. 2015 May;39(4):276-93.
doi: 10.1002/gepi.21896. Epub 2015 Mar 23.

Robust inference of population structure for ancestry prediction and correction of stratification in the presence of relatedness

Affiliations

Robust inference of population structure for ancestry prediction and correction of stratification in the presence of relatedness

Matthew P Conomos et al. Genet Epidemiol. 2015 May.

Abstract

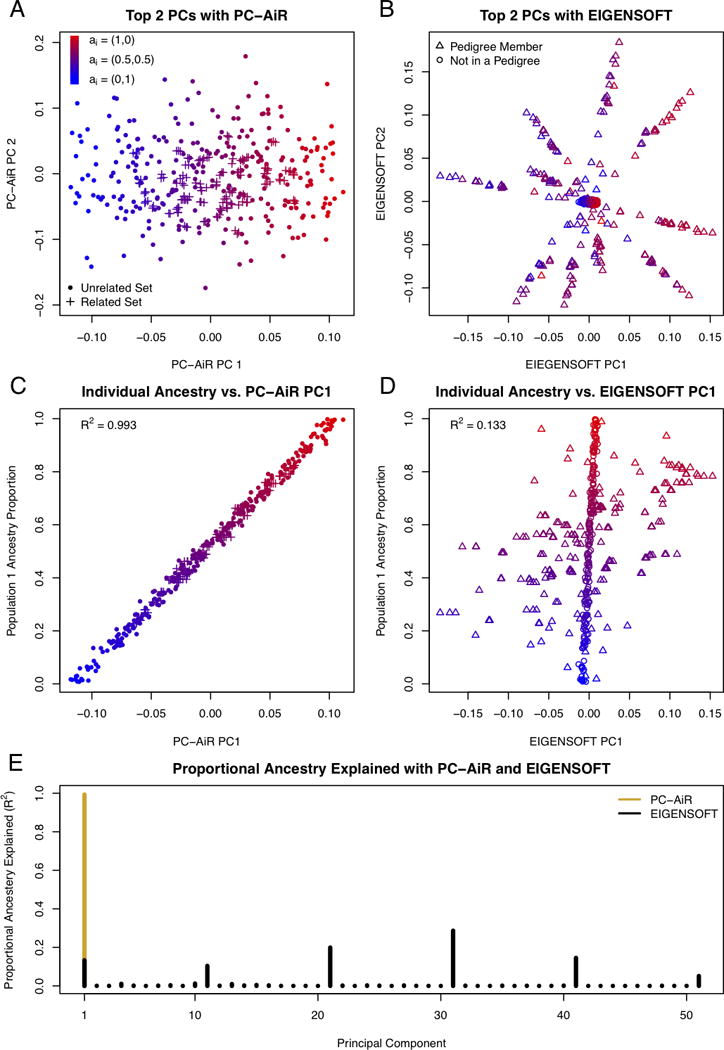
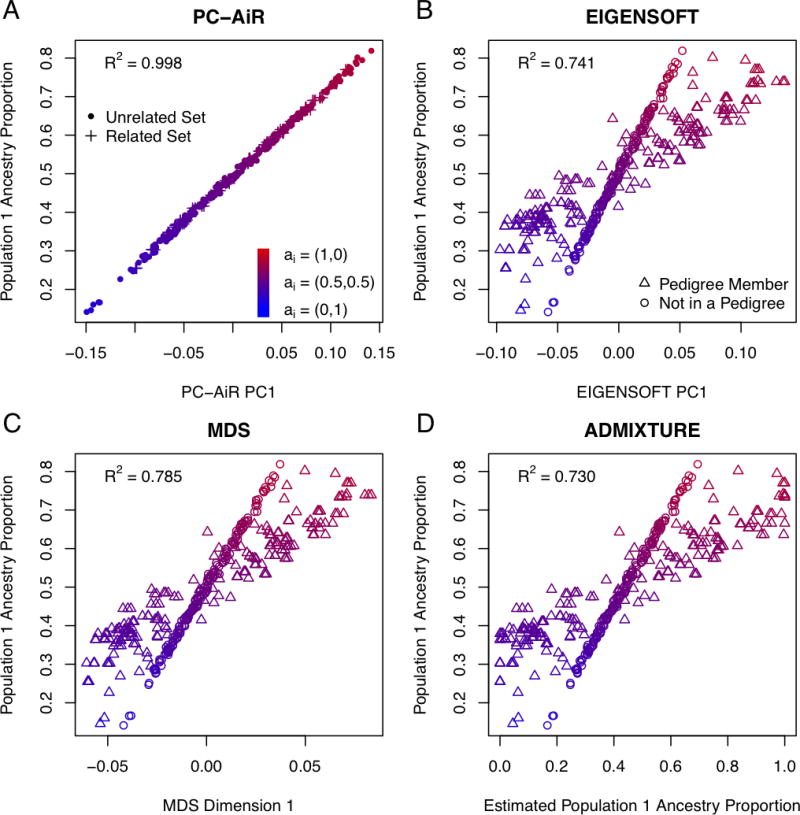
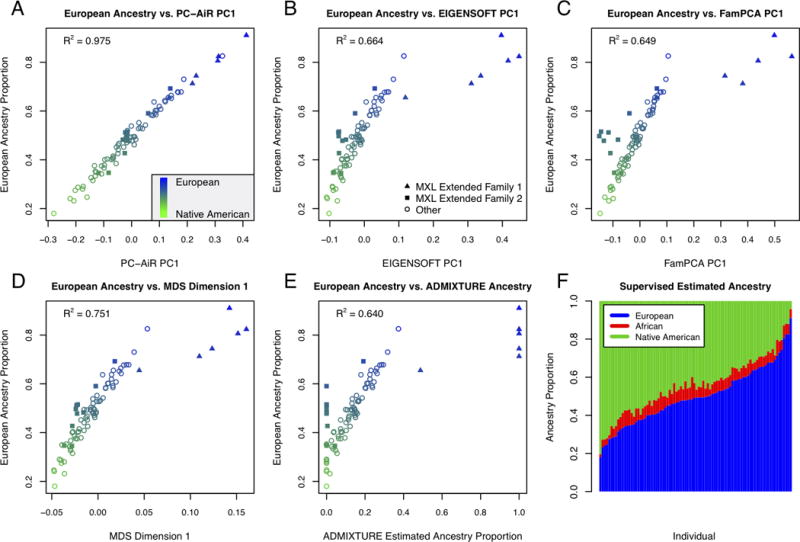
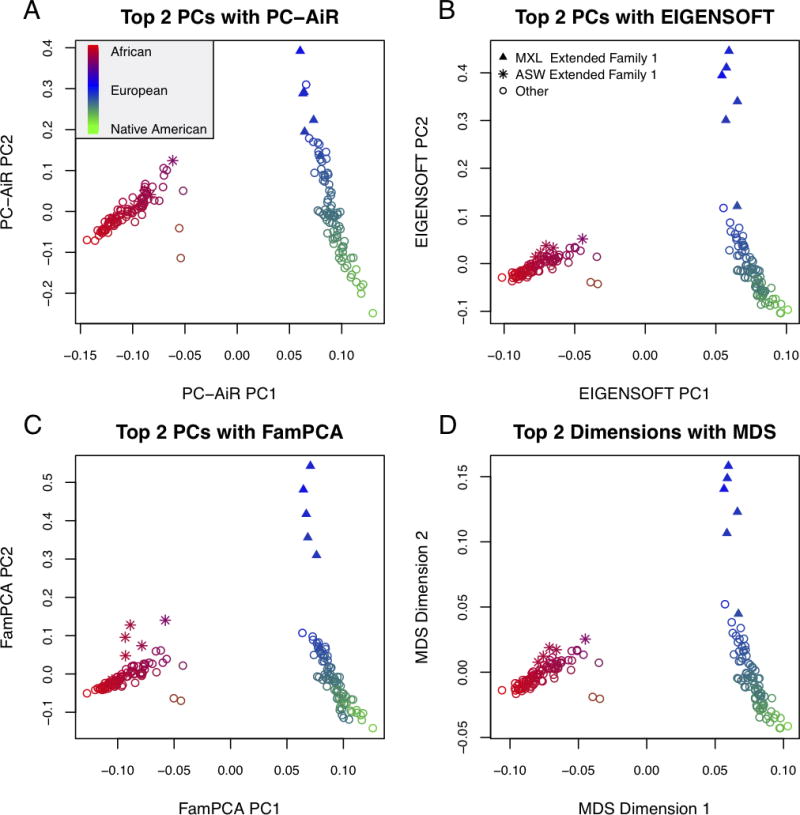
Population structure inference with genetic data has been motivated by a variety of applications in population genetics and genetic association studies. Several approaches have been proposed for the identification of genetic ancestry differences in samples where study participants are assumed to be unrelated, including principal components analysis (PCA), multidimensional scaling (MDS), and model-based methods for proportional ancestry estimation. Many genetic studies, however, include individuals with some degree of relatedness, and existing methods for inferring genetic ancestry fail in related samples. We present a method, PC-AiR, for robust population structure inference in the presence of known or cryptic relatedness. PC-AiR utilizes genome-screen data and an efficient algorithm to identify a diverse subset of unrelated individuals that is representative of all ancestries in the sample. The PC-AiR method directly performs PCA on the identified ancestry representative subset and then predicts components of variation for all remaining individuals based on genetic similarities. In simulation studies and in applications to real data from Phase III of the HapMap Project, we demonstrate that PC-AiR provides a substantial improvement over existing approaches for population structure inference in related samples. We also demonstrate significant efficiency gains, where a single axis of variation from PC-AiR provides better prediction of ancestry in a variety of structure settings than using 10 (or more) components of variation from widely used PCA and MDS approaches. Finally, we illustrate that PC-AiR can provide improved population stratification correction over existing methods in genetic association studies with population structure and relatedness.

Keywords: GWAS; PCA; admixture; cryptic relatedness; pedigrees.


Conflict of interest statement

The authors have no conflicts of interest to declare.

Figures

Figure 1
Figure 1
Comparison of PC-AiR and EIGENSOFT for Relationship Configuration I and Population Structure I with FST = 0.01. (A and B) Scatter plots of principal components 1 and 2 from PC-AiR (A) and EIGENSOFT (B), respectively. (C and D) Scatter plots of the simulated population 1 ancestry proportions vs. coordinates along principal component 1 for each individual from PC-AiR (C) and EIGENSOFT (D), respectively. (A–D) The color of a point represents the simulated ancestry of an individual; red for population 1, blue for population 2, and an intermediate color for an admixed individual. (A and C) A dot represents an individual in the mutually unrelated ancestry representative set, and a plus represents an individual in the related set. (B and D) A circle represents an individual not in a pedigree, and a triangle represents an individual who is a member of a pedigree. (E) Barplot of the efficiency of PC-AiR and EIGENSOFT. Each bar represents the proportion of ancestry explained (R2 value) by each principal component from PC-AiR (gold) and EIGENSOFT (black), until a cumulative R2 of 0.99 is achieved.
Figure 2
Figure 2
Population Structure Inference Results for Relationship Configuration I and Population Structure II with FST = 0.1. Scatter plots of the simulated population 1 ancestry proportions for each individual are plotted against: (A) coordinates along principal component 1 from PC-AiR, (B) coordinates along principal component 1 from EIGENSOFT, (C) coordinates along dimension 1 from MDS, and (D) the estimated ancestry proportions from ADMIXTURE for the inferred population with the highest R2. The color of a point represents the simulated ancestry of an individual; red for population 1, blue for population 2, and an intermediate color for an admixed individual. (A) A dot represents an individual in the mutually unrelated ancestry representative set, and a plus represents an individual in the related set. (B–D) A circle represents an individual not in a pedigree, and a triangle represents an individual who is a member of a pedigree.
Figure 3
Figure 3
Comparison of Population Structure Inference for the HapMap MXL Sample. Scatter plots of the European ancestry proportions estimated from a supervised individual ancestry analysis with ADMIXTURE for each individual are plotted against: (A) coordinates along principal component 1 from PC-AiR, (B) coordinates along principal component 1 from EIGENSOFT, (C) coordinates along principal component 1 from FamPCA, (D) coordinates along dimension 1 from MDS, and (E) the estimated ancestry proportions from an unsupervised analysis with ADMIXTURE for the inferred population with the highest R2. The color of a point represents the ancestry of an individual as estimated from a supervised individual ancestry analysis with ADMIXTURE; blue for European, green for Native American, and an intermediate color for an admixed individual. Individuals who are members of MXL Extended Family 1 or 2 are plotted as triangles or squares, respectively, and remaining individuals are plotted as circles. (F) Individual ancestry estimates for 86 HapMap MXL samples from a supervised individual ancestry analysis with ADMIXTURE. Each individual is represented by a vertical bar; estimated European (HapMap CEU), African (HapMap YRI), and Native American (HGDP samples from the Americas) ancestry proportions are shown in blue, red, and green, respectively.
Figure 4
Figure 4
Comparison of Population Structure Inference for the HapMap MXL and ASW Combined Sample. Scatter plots of the top two axes of variation from PC-AiR (A), EIGENSOFT (B), FamPCA (C), and MDS (D). The color of a point represents the ancestry of an individual as estimated from a supervised individual ancestry analysis with ADMIXTURE; blue for European (HapMap CEU), red for African (HapMap YRI), green for Native American (HGDP samples from the Americas), and an intermediate color for an admixed individual. Individuals who are members of MXL Extended Family 1 or ASW Extended Family 1 are plotted as triangles or stars, respectively, and remaining individuals are plotted as circles.

References

    1. Abney M. A graphical algorithm for fast computation of identity coefficients and generalized kinship coefficients. Bioinformatics. 2009;25(12):1561–1563. - PMC - PubMed
    1. Alexander DH, Novembre J, Lange K. Fast model-based estimation of ancestry in unrelated individuals. Genome Research. 2009;19(9):1655–1664. - PMC - PubMed
    1. Balding DJ, Nichols RA. A method for quantifying differentiation between populations at multi-allelic loci and its implications for investigating identity and paternity. Genetica. 1995;96:3–12. - PubMed
    1. Chen C-Y, Pollack S, Hunter DJ, Hirschhorn JN, Kraft P, Price AL. Improved ancestry inference using weights from external reference panels. Bioinformatics. 2013;29(11):1399–1406. - PMC - PubMed
    1. Devlin B, Roeder K. Genomic control for association studies. Biometrics. 1999;55(4):997–1004. - PubMed

Publication types