. 2015 May;77(4):1116-31.
doi: 10.3758/s13414-015-0870-0.

The capacity limitations of orientation summary statistics

Affiliations

The capacity limitations of orientation summary statistics

Mouna Attarha et al. Atten Percept Psychophys. 2015 May.

Abstract

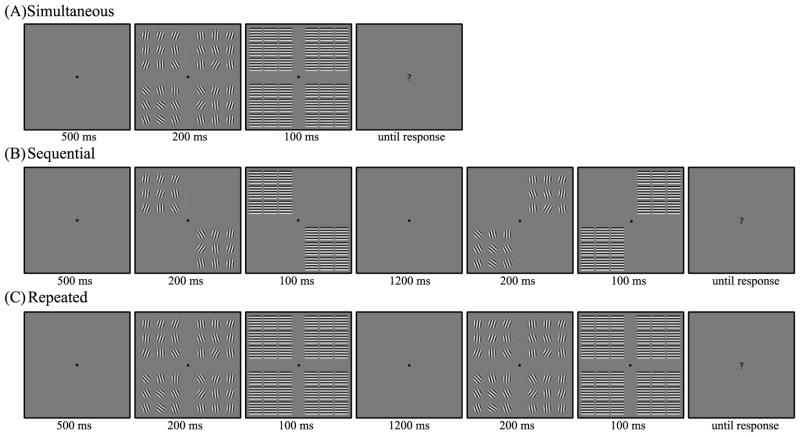
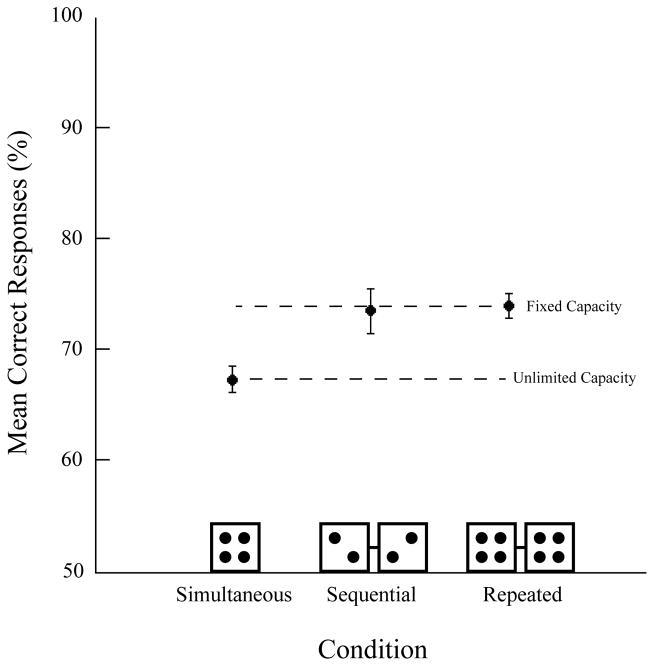
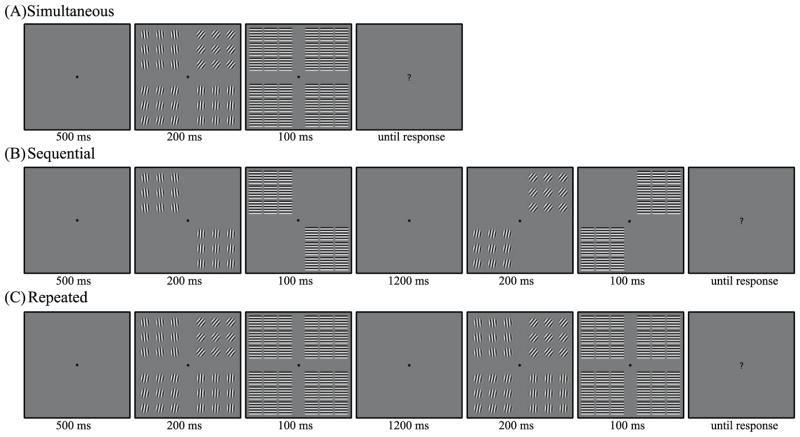
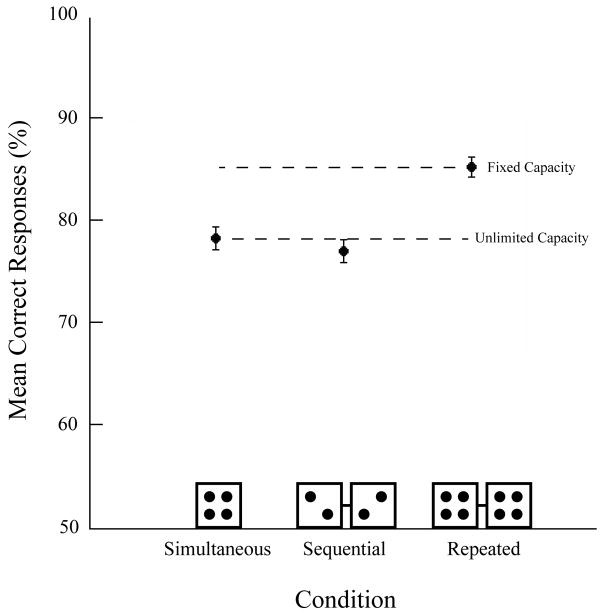
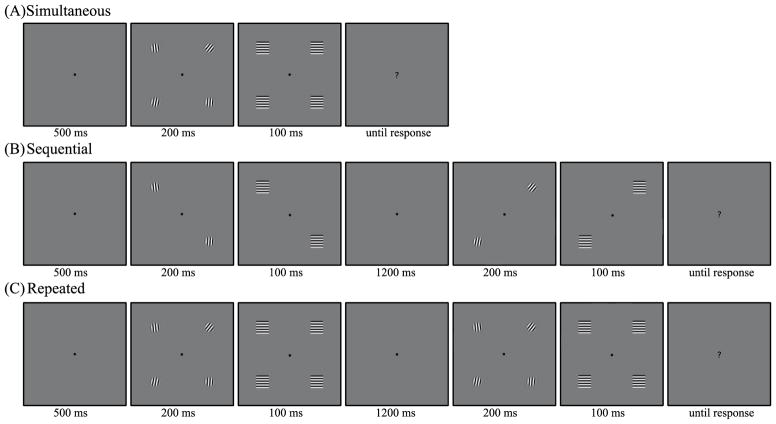
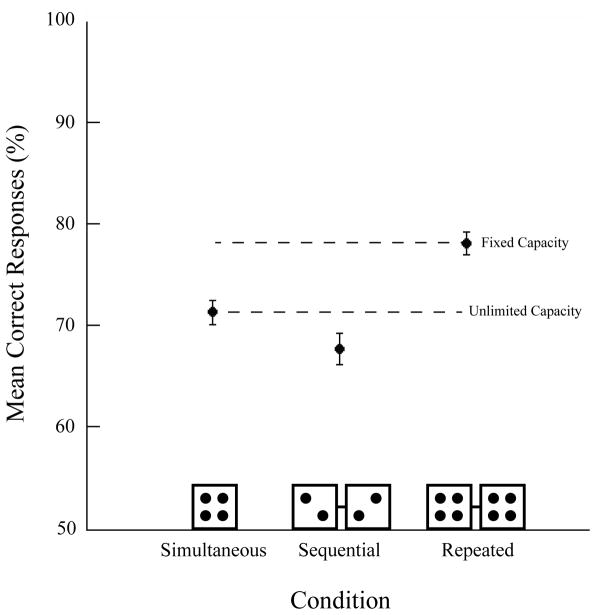
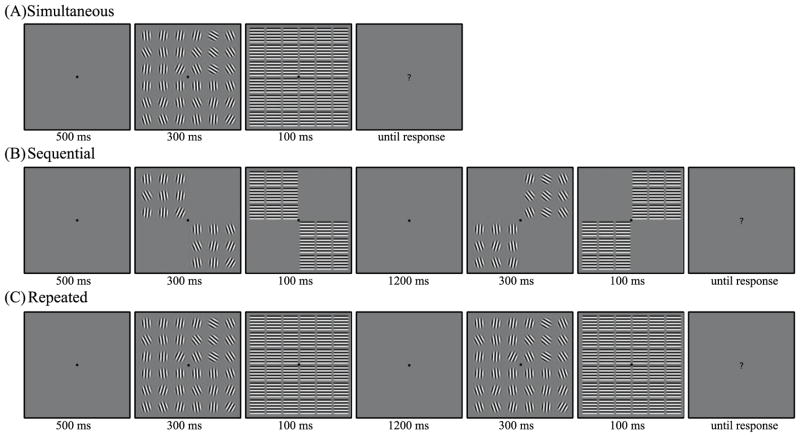
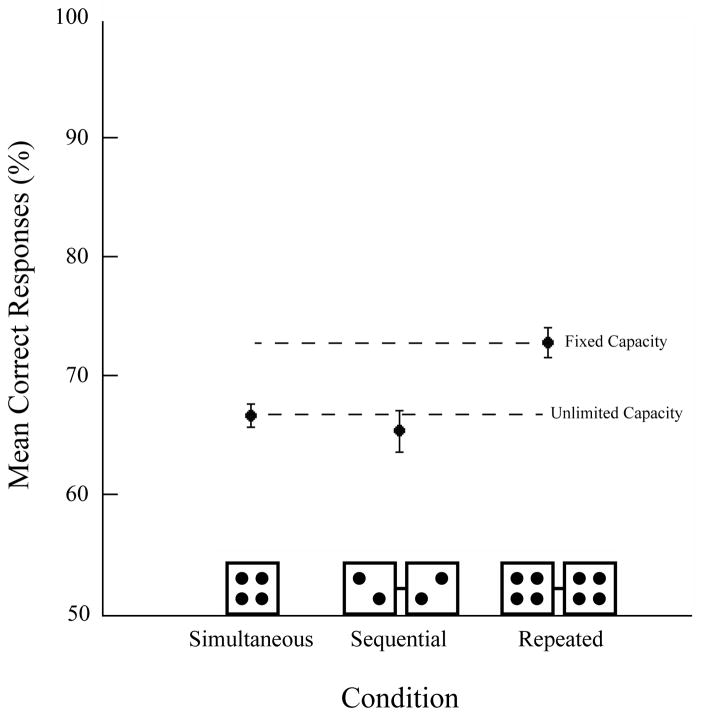
The simultaneous-sequential method was used to test the processing capacity of establishing mean orientation summaries. Four clusters of oriented Gabor patches were presented in the peripheral visual field. One of the clusters had a mean orientation that was tilted either left or right, whereas the mean orientations of the other three clusters were roughly vertical. All four clusters were presented at the same time in the simultaneous condition, whereas the clusters appeared in temporal subsets of two in the sequential condition. Performance was lower when the means of all four clusters had to be processed concurrently than when only two had to be processed in the same amount of time. The advantage for establishing fewer summaries at a given time indicates that the processing of mean orientation engages limited-capacity processes (Exp. 1). This limitation cannot be attributed to crowding, low target-distractor discriminability, or a limited-capacity comparison process (Exps. 2 and 3). In contrast to the limitations of establishing multiple summary representations, establishing a single summary representation unfolds without interference (Exp. 4). When interpreted in the context of recent work on the capacity of summary statistics, these findings encourage a reevaluation of the view that early visual perception consists of creating summary statistic representations that unfold independently across multiple areas of the visual field.


Figures

Figure 1
Figure 1
Trial events for the (A) simultaneous, (B) sequential, and (C) repeated conditions in Experiment 1. Observers saw four clusters of Gabor patches. One cluster consisted of tilted Gabors randomly sampled from a target distribution of orientations while the other three clusters consisted of Gabors sampled from a distractor distribution. Observers reported whether the mean orientation of the oddball cluster was tilted left or right relative to the others. The target cluster is tilted left and presented in the lower left corner in this example.
Figure 2
Figure 2
Mean correct responses (%) as a function of display collapsed across observers in Experiment 1. Performance in the sequential condition was better than performance in the simultaneous condition and equal to performance in the repeated condition. These results suggest that mean orientation SSRs for multiple sets engage fixed-capacity processes. Error bars are within-subject 95% confidence intervals (Cousineau, 2005; Moray, 2008).
Figure 3
Figure 3
Trial events for the (A) simultaneous, (B) sequential, and (C) repeated conditions in Experiment 2. The mean orientation of each cluster was calculated after the orientations of Gabors within each cluster were sampled from their respective distributions. All Gabors within a given cluster was then adjusted according to that cluster’s mean. Establishing summary representations are no longer necessary to perform the task. The target cluster is tilted right and presented in the upper right corner in this example.
Figure 4
Figure 4
Mean correct responses (%) as a function of display collapsed across observers in Experiment 2. Performance was equal across the simultaneous and sequential conditions. There was also a reliable advantage in the repeated condition. Evidence consistent with unlimited-capacity processing was obtained when the task no longer required that subjects compute the average of each cluster. Error bars are within-subject 95% confidence intervals (Cousineau, 2005; Moray, 2008).
Figure 5
Figure 5
Trial events for the (A) simultaneous, (B) sequential, and (C) repeated conditions in Experiment 3. Observers were given the mean of each cluster, which was represented by the orientation of a single circle. The correct response is tilted right in this example.
Figure 6
Figure 6
Mean correct responses (%) as a function of display collapsed across observers in Experiment 3. Performance was equal across the simultaneous and sequential conditions and there was also a reliable advantage in the repeated condition. These results are consistent with the unlimited-capacity model. Error bars are within-subject 95% confidence intervals (Cousineau, 2005; Moray, 2008).
Figure 7
Figure 7
Trial events for the (A) simultaneous, (B) sequential, and (C) repeated conditions in Experiment 4. The four clusters from Experiment 1 were presented on an equally spaced grid to produce a single cluster with 36 items. Observers reported whether the mean orientation of the entire cluster was tilted left or right relative to vertical. The correct answer in this example is tilted left.
Figure 8
Figure 8
Mean correct responses (%) as a function of display collapsed across observers in Experiment 4. Evidence consistent with unlimited capacity was obtained when summary statistics were computed for a single set. Error bars are within-subject 95% confidence intervals (Cousineau, 2005; Moray, 2008).

References

    1. Ackermann JF, Landy MS. Statistical templates for visual search. Journal of Vision. 2014;14(3):1–17. doi: 10.1167/14.3.18. - DOI - PMC - PubMed
    1. Albrecht AR, Scholl BJ. Perceptually Averaging in a Continuous Visual World: Extracting Statistical Summary Representations Over Time. Psychological Science. 2010;21(4):560–567. - PubMed
    1. Allik J, Toom M, Raidvee A, Averin K, Kreegipuu K. An almost general theory of mean size perception. Vision Research. 2013;83:25–39. - PubMed
    1. Alvarez GA. Representing multiple objects as an ensemble enhances visual cognition. Trends in Cognitive Sciences. 2011;15(3):122–131. - PubMed
    1. Alvarez GA, Oliva A. The representation of simple ensemble visual features outside the focus of attention. Psychological Science. 2008;19(4):392–398. - PMC - PubMed

Publication types

LinkOut - more resources