Multicenter Study
. 2015 Jun 2;131(22):1950-9.
doi: 10.1161/CIRCULATIONAHA.114.013698. Epub 2015 Mar 25.

Cardiac electrophysiological substrate underlying the ECG phenotype and electrogram abnormalities in Brugada syndrome patients

Affiliations
Multicenter Study

Cardiac electrophysiological substrate underlying the ECG phenotype and electrogram abnormalities in Brugada syndrome patients

Junjie Zhang et al. Circulation. .

Abstract

Background: Brugada syndrome (BrS) is a highly arrhythmogenic cardiac disorder, associated with an increased incidence of sudden death. Its arrhythmogenic substrate in the intact human heart remains ill-defined.

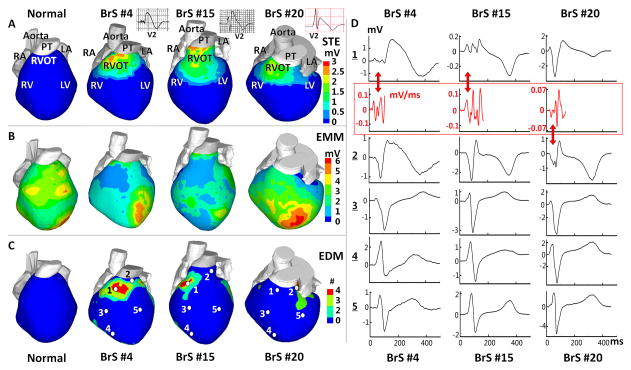
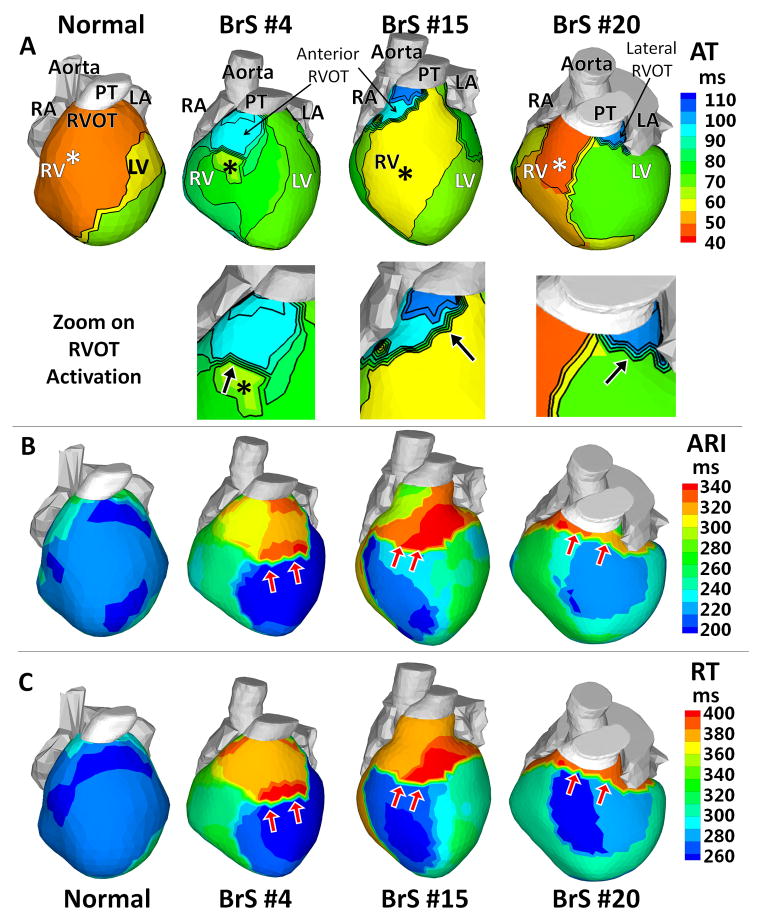
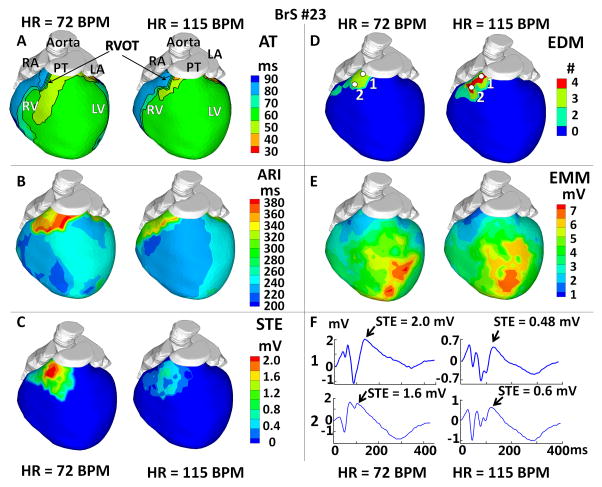
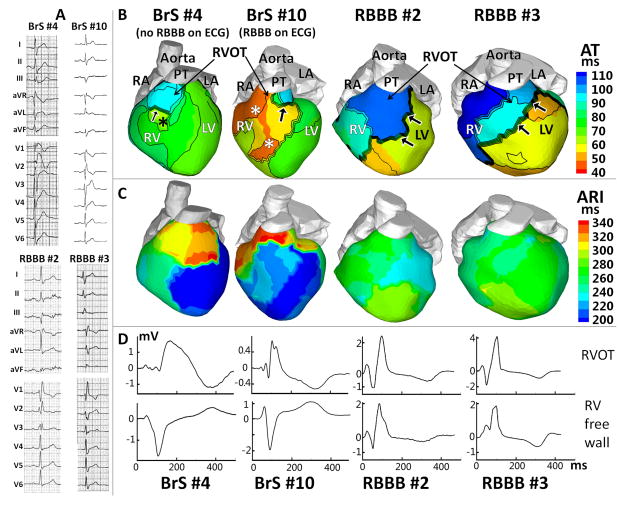
Methods and results: Using noninvasive ECG imaging, we studied 25 BrS patients to characterize the electrophysiological substrate and 6 patients with right bundle-branch block for comparison. Seven healthy subjects provided control data. Abnormal substrate was observed exclusively in the right ventricular outflow tract with the following properties (in comparison with healthy controls; P<0.005): (1) ST-segment elevation and inverted T wave of unipolar electrograms (2.21±0.67 versus 0 mV); (2) delayed right ventricular outflow tract activation (82±18 versus 37±11 ms); (3) low-amplitude (0.47±0.16 versus 3.74±1.60 mV) and fractionated electrograms, suggesting slow discontinuous conduction; (4) prolonged recovery time (381±30 versus 311±34 ms) and activation-recovery intervals (318±32 versus 241±27 ms), indicating delayed repolarization; (5) steep repolarization gradients (Δrecovery time/Δx=96±28 versus 7±6 ms/cm, Δactivation-recovery interval/Δx=105±24 versus 7±5 ms/cm) at right ventricular outflow tract borders. With increased heart rate in 6 BrS patients, reduced ST-segment elevation and increased fractionation were observed. Unlike BrS, right bundle-branch block had delayed activation in the entire right ventricle, without ST-segment elevation, fractionation, or repolarization abnormalities on electrograms.

Conclusions: The results indicate that both slow discontinuous conduction and steep dispersion of repolarization are present in the right ventricular outflow tract of BrS patients. ECG imaging could differentiate between BrS and right bundle-branch block.

Keywords: Brugada syndrome; electrocardiography; electrophysiology.


Figures

Figure 1
Figure 1
Abnormal Epicardial Electrograms (EGMs) Characteristics and Localization. (A) Peak ST Segment elevation (STE) magnitude map. Insets show ECG lead V2. (B) EGM magnitude map (EMM). (C) EGM deflection map (EDM) showing number (#) of low amplitude deflections. BrS maps are in 3 right columns; left column shows corresponding maps from a normal subject for reference. (D) Unipolar EGMs from locations marked by white dots in Panel C. 1-Anterior RVOT, 2-Lateral RVOT, 3-RV free wall, 4-RV apex, 5-LV free wall (EGMs from other LV sites are also normal). Red traces: time derivatives of fractionated QRS. The derivatives approximate bipolar EGMs and emphasize fractionation. Maps are shown in anterior view. Each BrS column shows maps/EGMs from one patient identified by BrS#. RA: right atrium, LA: left atrium, RV: right ventricle, LV: left ventricle, RVOT: right ventricular outflow tract, PT: pulmonary trunk. Red arrows point to low voltage and fractionated EGMs.
Figure 2
Figure 2
Activation and Repolarization during Sinus Rhythm. (A) Activation times isochrone maps (AT). Lower panels: zoom on the RVOT. (B) Activation-recovery interval maps (ARI). (C) Recovery time maps (RT). Epicardial breakthroughs are indicated by asterisks. Isochrones are depicted in thin black lines. Black arrows in the RVOT zoom maps of Panel A point to slow conduction indicated by crowded isochronal lines. Red arrows in Panels B–C point to regions with steep repolarization gradients.
Figure 3
Figure 3
Effects of Increased Heart Rate (HR). (A) Activation isochrone maps (AT). (B) Activation-recovery interval maps (ARI). (C) Peak ST segment elevation magnitude maps (STE). (D) Electrogram deflection maps (EDM), showing number (#) of deflection on EGM. (E) Electrogram magnitude maps (EMM). (F) EGMs from RVOT locations marked by white dots in Panel D. Each panel shows the map at resting (75 BPM) and increased HR (115 BPM).
Figure 4
Figure 4
Comparison between BrS and Non-BrS RBBB. (A) 12-lead ECGs. (B) Activation isochrone maps (AT). (C) Activation-recovery interval maps (ARI). (D) EGMs from the RVOT (top) and RV free wall (bottom). ECGs, maps and EGMs are shown for 4 representative examples (BrS#4: spontaneous Brugada ECG pattern. BrS#10: BrS patient with RBBB ECG pattern. RBBB#2 and RBBB#3: Non-BrS patients with RBBB ECG patterns). Epicardial breakthroughs are indicated by asterisks. Black arrows point to slow conduction in RVOT (BrS) or across the septum (RBBB).
Figure 5
Figure 5
Computer Simulation of BrS Effects on a Human RVOT AP. At pacing rate of 1 Hz and 0.5 Hz, APD90 (APD at 90% repolarization) was plotted versus Ito conductance increase (Gto from 1.0 to 2.5 fold). Colors indicate different amounts of INa conductance reduction (GNa from 100 to 10%). APs and their duration are shown for Gto/GNa pairings selected to illustrate the behaviors of interest: control– A and I; AP prolongation – B, C, E, F, J, and L; premature repolarization and AP shortening – D, G, H, and M; alternating AP prolongation and shortening – D, E, and F, G, H. Letters A through M relate the summary data above with each of the APs in the traces below. The simulations demonstrate bi-phasic changes of APD (prolongation followed by shortening). Prolongation was greater when INa was reduced. With INa loss, there was a critical degree of Ito enhancement beyond which APs fully repolarized prematurely at phase-1, causing loss of plateau and APD shortening. Just below this critical degree, APs could alternate between premature repolarization and prolongation.

References

    1. Antzelevitch C, Brugada P, Borggrefe M, Brugada J, Brugada R, Corrado D, Gussak I, LeMarec H, Nademanee K, Riera ARP, Shimizu W, Schulze-Bahr E, Tan HL, Wilde AA. Brugada syndrome: Report of the second consensus conference endorsed by the Heart Rhythm Society and the European Heart Rhythm Association. Circulation. 2005;111:659–670. - PubMed
    1. Brugada P, Brugada J. Right bundle branch block, persistent ST segment elevation and sudden cardiac death: A distinct clinical and electrocardiographic syndrome. A multicenter report. J Am Coll Cardiol. 1992;20:1391–1396. - PubMed
    1. Antzelevitch C. Cellular basis and mechanism underlying normal and abnormal myocardial repolarization and arrhythmogenesis. Ann Med. 2004;36:5–14. - PubMed
    1. Szél T, Antzelevitch C. Abnormal repolarization as the basis for late potentials and fractionated electrograms recorded from epicardium in experimental models of Brugada syndrome. J Am Coll Cardiol. 2014;63:2037–2045. - PMC - PubMed
    1. Aiba T, Shimizu W, Hidaka I, Uemura K, Noda T, Zheng C, Kamiya A, Inagaki M, Sugimachi M, Sunagawa K. Cellular Basis for Trigger and Maintenance of Ventricular Fibrillation in the Brugada Syndrome ModelHigh-Resolution Optical Mapping Study. J Am Coll Cardiol. 2006;47:2074–2085. - PubMed

Publication types

MeSH terms