

Pregnant rats treated with a high-fat/prooxidant Western diet with ANG II and TNF-α are resistant to elevations in blood pressure and renal oxidative stress
- PMID: 25810384
- PMCID: PMC4451392
- DOI: 10.1152/ajpregu.00141.2014
Pregnant rats treated with a high-fat/prooxidant Western diet with ANG II and TNF-α are resistant to elevations in blood pressure and renal oxidative stress
Abstract
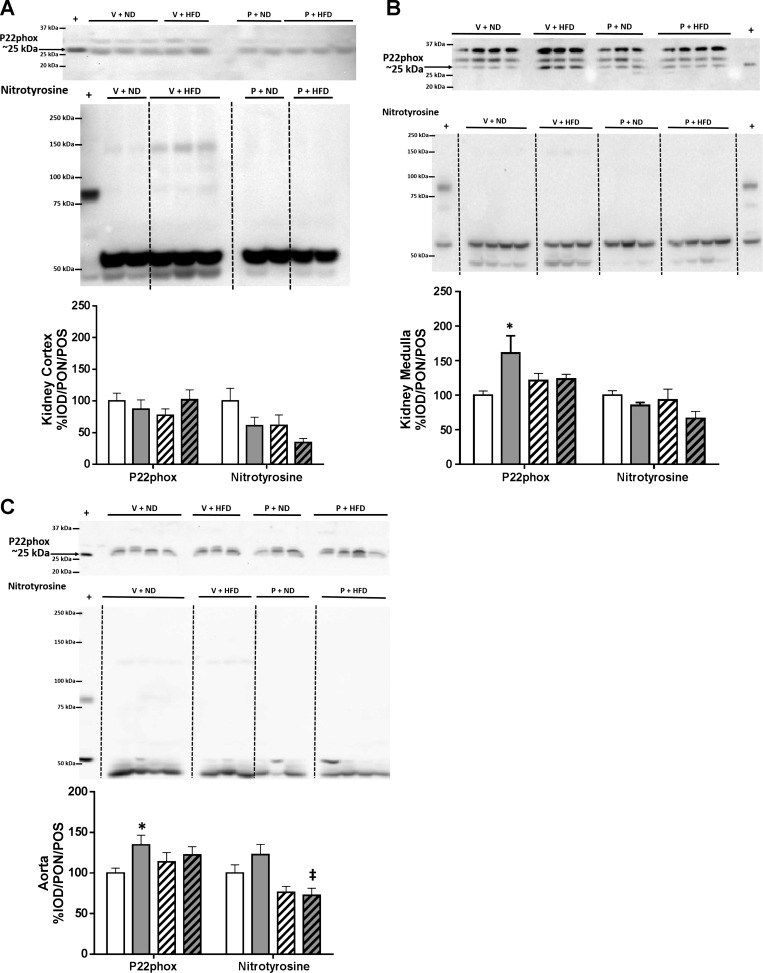
Oxidative stress and inflammation are risk factors for hypertension in pregnancy. Here, we examined the 24-h mean arterial pressure (MAP) via telemetry and the nitric oxide (NO) and redox systems in the kidney cortex, medulla, and aorta of virgin and pregnant rats treated with a high-fat/prooxidant Western diet (HFD), ANG II, and TNF-α. Female Sprague-Dawley rats were given a normal diet (ND) or a HFD for 8 wk before mating. Day 6 of pregnancy and age-matched virgins were implanted with minipumps infusing saline or ANG II (150 ng·kg(-1)·min(-1)) + TNF-α (75 ng/day) for 14 days. Groups consisted of Virgin + ND + Saline (V+ND) (n = 7), Virgin + HFD +ANG II and TNF-α (V+HFD) (n = 7), Pregnant + ND + Saline (P+ND) (n = 6), and Pregnant + HFD + ANG II and TNF-α (P+HFD) (n = 8). After day 6 of minipump implantation, V+HFD rats displayed an increase in MAP on days 7, 8, and 10-15 vs. V+ND rats. P+HFD rats, after day 6 of minipump implantation, showed an increase in MAP only on day 7 vs. P+ND rats. P+HFD rats had a normal fall in 24-h MAP, hematocrit, plasma protein concentration, and osmolality at late pregnancy. No change in kidney cortex, medulla, or aortic oxidative stress in P+HFD rats. P+HFD rats displayed a decrease in nNOSβ abundance, but no change in kidney cortex NOx content vs. P+ND rats. Pregnant rats subjected to a chronic HFD and prooxidant and proinflammatory insults have a blunted increase in 24-h MAP and renal oxidative stress. Our data suggest renal NO bioavailability is not altered in pregnant rats treated with a HFD, ANG II, and TNF-α.
Keywords: ANG II; Western diet; nitric oxide; oxidative stress; tumor necrosis factor-α.
Copyright © 2015 the American Physiological Society.
Figures


Similar articles
-
Maternal high-fat diet acts on the brain to induce baroreflex dysfunction and sensitization of angiotensin II-induced hypertension in adult offspring.Am J Physiol Heart Circ Physiol. 2018 May 1;314(5):H1061-H1069. doi: 10.1152/ajpheart.00698.2017. Epub 2018 Jan 26. Am J Physiol Heart Circ Physiol. 2018. PMID: 29373045 Free PMC article.
-
Blockade of angiotensin-converting enzyme or tumor necrosis factor-α reverses maternal high-fat diet-induced sensitization of angiotensin II hypertension in male rat offspring.Am J Physiol Regul Integr Comp Physiol. 2020 Feb 1;318(2):R351-R359. doi: 10.1152/ajpregu.00200.2019. Epub 2019 Nov 20. Am J Physiol Regul Integr Comp Physiol. 2020. PMID: 31746626 Free PMC article.
-
Inhibition of TNF in the brain reverses alterations in RAS components and attenuates angiotensin II-induced hypertension.PLoS One. 2013 May 15;8(5):e63847. doi: 10.1371/journal.pone.0063847. Print 2013. PLoS One. 2013. PMID: 23691105 Free PMC article.
-
Molecular mechanisms and therapeutic strategies of chronic renal injury: physiological role of angiotensin II-induced oxidative stress in renal medulla.J Pharmacol Sci. 2006 Jan;100(1):2-8. doi: 10.1254/jphs.fmj05003x2. Epub 2006 Jan 11. J Pharmacol Sci. 2006. PMID: 16404134 Review.
-
Role of oxidative stress in angiotensin-induced hypertension.Am J Physiol Regul Integr Comp Physiol. 2003 Apr;284(4):R893-912. doi: 10.1152/ajpregu.00491.2002. Am J Physiol Regul Integr Comp Physiol. 2003. PMID: 12626356 Review.
Cited by
-
Relaxin-mediated renal vasodilation in the rat is associated with falls in glomerular blood pressure.Am J Physiol Regul Integr Comp Physiol. 2018 Feb 1;314(2):R147-R152. doi: 10.1152/ajpregu.00148.2017. Epub 2017 Oct 18. Am J Physiol Regul Integr Comp Physiol. 2018. PMID: 29046312 Free PMC article.
-
Intrauterine growth-restricted pregnant rats, from placental ischemic dams, display preeclamptic-like symptoms: A new rat model of preeclampsia.Physiol Rep. 2024 Nov;12(21):e70112. doi: 10.14814/phy2.70112. Physiol Rep. 2024. PMID: 39482843 Free PMC article.
References
-
- Alexander BT, Cockrell KL, Massey MB, Bennett WA, Granger JP. Tumor necrosis factor-α-induced hypertension in pregnant rats results in decreased renal neuronal nitric oxide synthase expression. Am J Hypertens 15: 170–175, 2002. - PubMed
-
- Baylis C, Engels K. Adverse interactions between pregnancy and a new model of systemic hypertension produced by chronic blockade of EDRF in the rat. Clin Exp Hypertens B11: 117–129, 1992.
-
- Baylis C. Glomerular filtration and volume regulation in gravid animal models. Baillieres Clin Obstet Gynaecol 8: 235–264, 1994. - PubMed
-
- Belo L, Caslake M, Santos-Silva A, Castro EMB, Pereira-Leite L, Quintanilha A, Rebelo I. LDL size, total antioxidant status and oxidized LDL in normal human pregnancy: a longitudinal study. Atherosclerosis 177: 361–399, 2004. - PubMed
-
- Bozkurt B, Kribbs SB, Clubb FJ Jr, Michael LH, Didenko VV, Hornsby PJ, Seta Y, Oral H, Spinale FG, Mann DL. Pathophysiologically relevant concentrations of tumor necrosis factor-α promote progressive left ventricular dysfunction and remodeling in rats. Circulation 97: 1382–1391, 1998. - PubMed
Publication types
MeSH terms
Substances
Grants and funding
LinkOut - more resources
Full Text Sources
Other Literature Sources
Medical
Miscellaneous