. 2015 May;26(5):583-92.
doi: 10.1177/0956797615569578. Epub 2015 Mar 25.

Social influence on risk perception during adolescence

Affiliations

Social influence on risk perception during adolescence

Lisa J Knoll et al. Psychol Sci. 2015 May.

Abstract

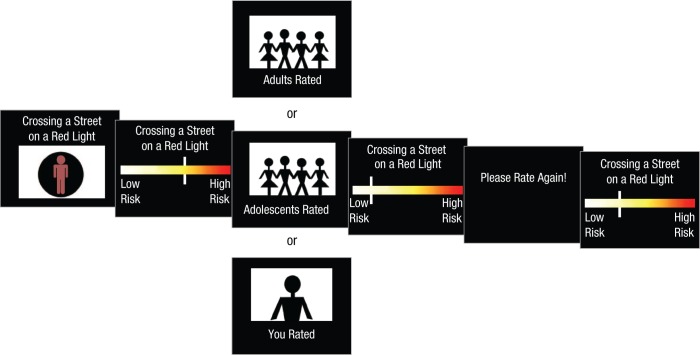
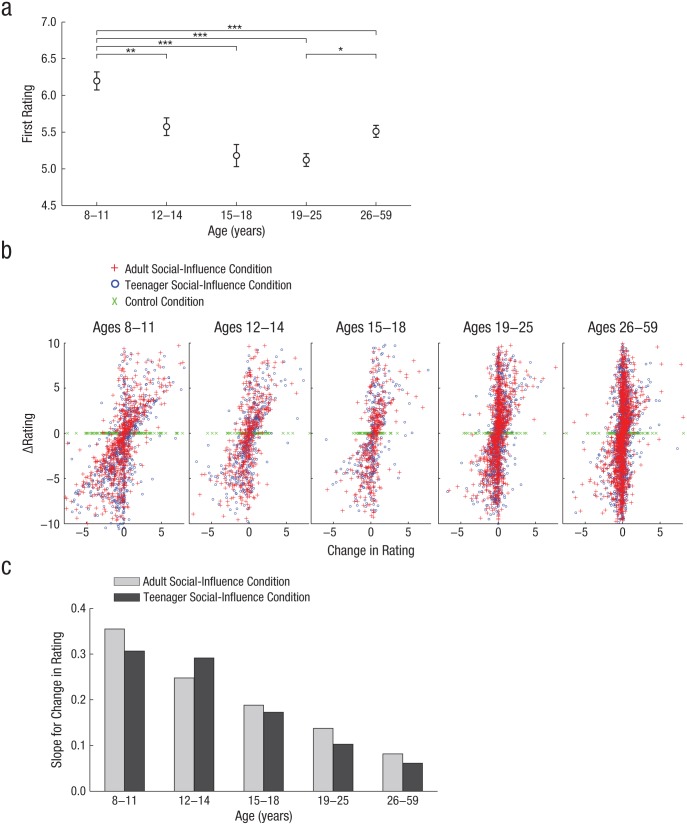
Adolescence is a period of life in which peer relationships become increasingly important. Adolescents have a greater likelihood of taking risks when they are with peers rather than alone. In this study, we investigated the development of social influence on risk perception from late childhood through adulthood. Five hundred and sixty-three participants rated the riskiness of everyday situations and were then informed about the ratings of a social-influence group (teenagers or adults) before rating each situation again. All age groups showed a significant social-influence effect, changing their risk ratings in the direction of the provided ratings; this social-influence effect decreased with age. Most age groups adjusted their ratings more to conform to the ratings of the adult social-influence group than to the ratings of the teenager social-influence group. Only young adolescents were more strongly influenced by the teenager social-influence group than they were by the adult social-influence group, which suggests that to early adolescents, the opinions of other teenagers about risk matter more than the opinions of adults.

Keywords: adolescence; conformity; development; peer influence; risk perception; social influence.


Conflict of interest statement

Declaration of Conflicting Interests: The authors declared that they had no conflicts of interest with respect to their authorship or the publication of this article.

Figures

Fig. 1.
Fig. 1.
Illustration of the trial sequence. Participants were asked to imagine that someone was engaged in an activity (in this example, crossing the street on a red light). They then rated the activity’s risk by using a computer mouse to move a slider on a visual analogue scale. There was no time restriction for this first rating. After making this rating, participants were shown (for 2 s) a risk rating of the same situation that was ostensibly provided by a group of either adults or teenagers (the social-influence conditions) or was the participant’s own rating (control condition). The ratings from the social-influence groups were actually randomly generated. Finally, participants were asked to rate the same situation again. There was no time restriction for the second rating. The next trial started after 1 s.
Fig. 2.
Fig. 2.
Results. The graph in (a) shows mean first risk rating as a function of age group: children (ages 8–11), young adolescents (ages 12–14), midadolescents (ages 15–18), young adults (ages 19–25), and adults (ages 26–59). The possible range of rating was from 0 (low risk) to 10 (high risk). Error bars represent ±1 SE. Asterisks indicate statistically significant differences between groups (*p < .05, **p < .01, ***p < .001; Bonferroni corrected). The scatter plots (b) illustrate the relationship between Δrating (the difference between the provided rating and the first rating) and change in rating (the difference between the second rating and the first rating) separately for each of the five age groups. Each symbol represents a single trial. Note that Δrating for the control condition was always zero. The graph in (c) presents the slopes for the average change in risk rating predicted by the difference between the provided rating and the first rating (Δrating). Results are shown separately for the adult social-influence condition and the teenager social-influence condition, for each age group. The slopes were calculated using estimates of the linear mixed-effect model analysis.

References

    1. Anderson P. (2002). Assessment and development of executive function (EF) during childhood. Child Neuropsychology, 8, 71–82. doi:10.1076/chin.8.2.71.8724 - DOI - PubMed
    1. Berndt T. J. (1979). Developmental changes in conformity to peers and parents. Developmental Psychology, 15, 608–616. doi:10.1037/0012-1649.15.6.608 - DOI
    1. Berns G. S., Capra C. M., Moore S., Noussair C. (2010). Neural mechanisms of the influence of popularity on adolescent ratings of music. NeuroImage, 49, 2687–2696. doi:10.1016/j.neuroimage.2009.10.070 - DOI - PMC - PubMed
    1. Blakemore S.-J., Mills K. L. (2014). Is adolescence a sensitive period for sociocultural processing? Annual Review of Psychology, 65, 187–207. doi:10.1146/annurev-psych-010213-115202 - DOI - PubMed
    1. Brown B. B. (1990). Peer groups and peer cultures. In Feldman S. S., Elliott G. R. (Eds.), At the threshold: The developing adolescent (pp. 171–196). Cambridge, MA: Harvard University Press.

Publication types