

Overweight and Obesity in Midlife and Brain Structure and Dementia 26 Years Later: The AGES-Reykjavik Study
- PMID: 25810457
- PMCID: PMC4408946
- DOI: 10.1093/aje/kwu331
Overweight and Obesity in Midlife and Brain Structure and Dementia 26 Years Later: The AGES-Reykjavik Study
Abstract
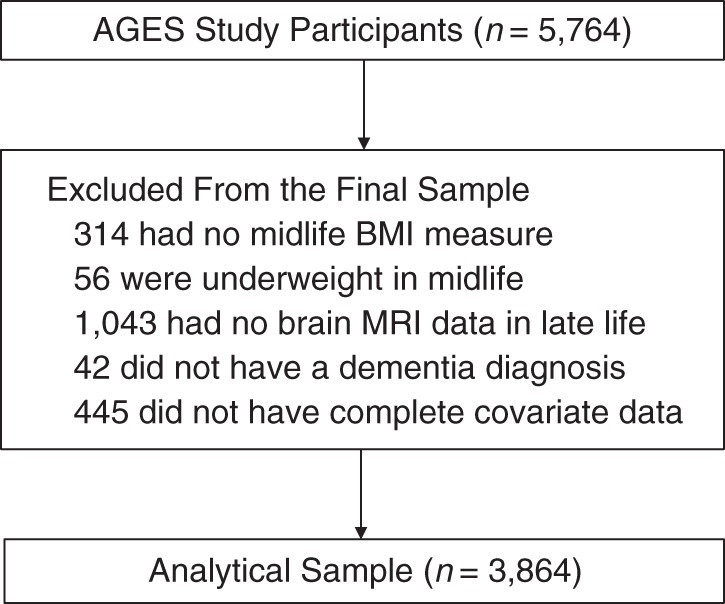
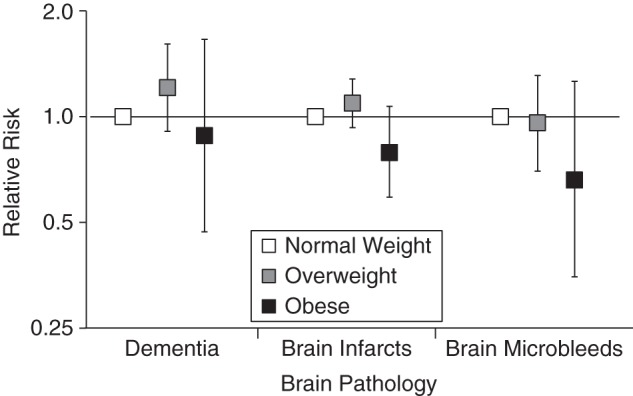
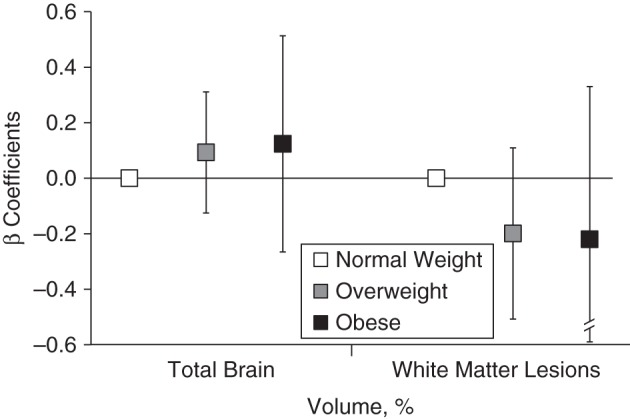
High adiposity in midlife might increase risk for late-life brain pathology, including dementia. Using data from the prospective Age, Gene/Environment Susceptibility-Reykjavik Study of men and women (born 1907-1935), we studied the associations of overweight and obesity at midlife (mean age, 50 (standard deviation, 4.7) years) with 1.5-T brain magnetic resonance imaging measures of infarct-like brain lesions, cerebral microbleeds, total brain volume, and white matter lesions volume, as well as dementia, in late life (mean age, 76 (standard deviation, 5.2) years). We used linear and Poisson models to estimate associations in 3,864 persons after adjustment for sociodemographic, health, and lifestyle characteristics. In midlife, the prevalence of overweight was 39% and that of obesity was 8%. After a mean follow-up of 26.2 (standard deviation, 4.9) years, midlife overweight and obesity were not associated with infarct-like brain lesions (relative risk (RR) = 0.82, 95% confidence interval (CI): 0.61, 1.10), cerebral microbleeds (RR = 0.69, 95% CI: 0.37, 1.32), total brain volume (β = 0.05, 95% CI: -0.34, 0.45), white matter lesions volume (β = -0.10, 95% CI: -0.20, 0.01), or dementia (RR = 0.91, 95% CI: 0.49, 1.72) compared with normal weight. These findings do not support the hypothesis that high body mass index in midlife modulates the risk for dementia.
Keywords: brain MRI; brain vascular lesions; cohort study; dementia; epidemiology; mortality; obesity.
Published by Oxford University Press on behalf of the Johns Hopkins Bloomberg School of Public Health 2015. This work is written by (a) US Government employee(s) and is in the public domain in the US.
Figures
References
-
- Prince M, Bryce R, Albanese E, et al. The global prevalence of dementia: a systematic review and metaanalysis. Alzheimers Dement. 2013;91:63–75.e2. - PubMed
-
- Daviglus ML, Bell CC, Berrettini W, et al. NIH state-of-the-science conference statement: preventing Alzheimer's disease and cognitive decline. NIH Consens State Sci Statements. 2010;274:1–30. - PubMed
-
- Jagust W. What can imaging reveal about obesity and the brain? Curr Alzheimer Res. 2007;42:135–139. - PubMed
Publication types
MeSH terms
Grants and funding
LinkOut - more resources
Full Text Sources
Other Literature Sources
Medical
