. 2015 Jun 1;113(10):3474-89.
doi: 10.1152/jn.00237.2015. Epub 2015 Mar 25.

Brain-wide analysis of electrophysiological diversity yields novel categorization of mammalian neuron types

Affiliations

Brain-wide analysis of electrophysiological diversity yields novel categorization of mammalian neuron types

Shreejoy J Tripathy et al. J Neurophysiol. .

Abstract

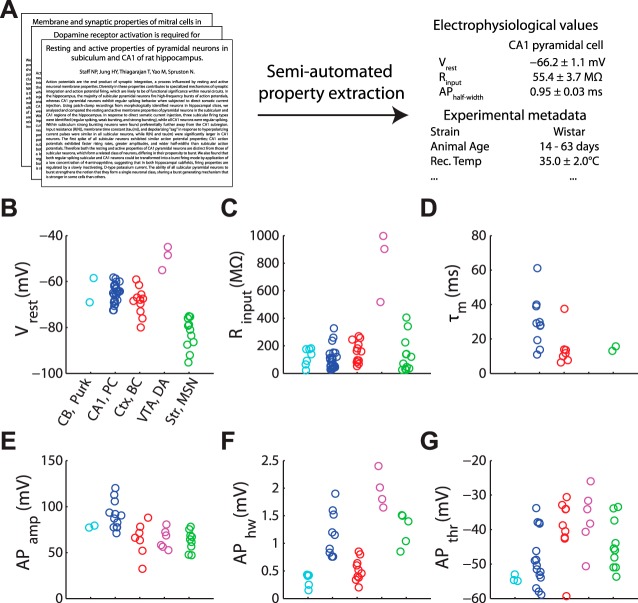
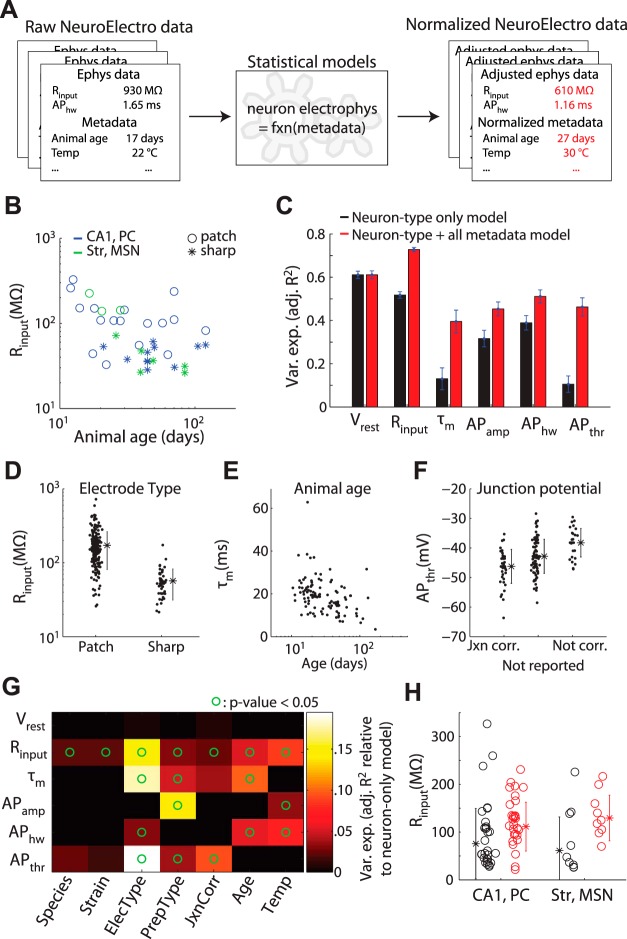
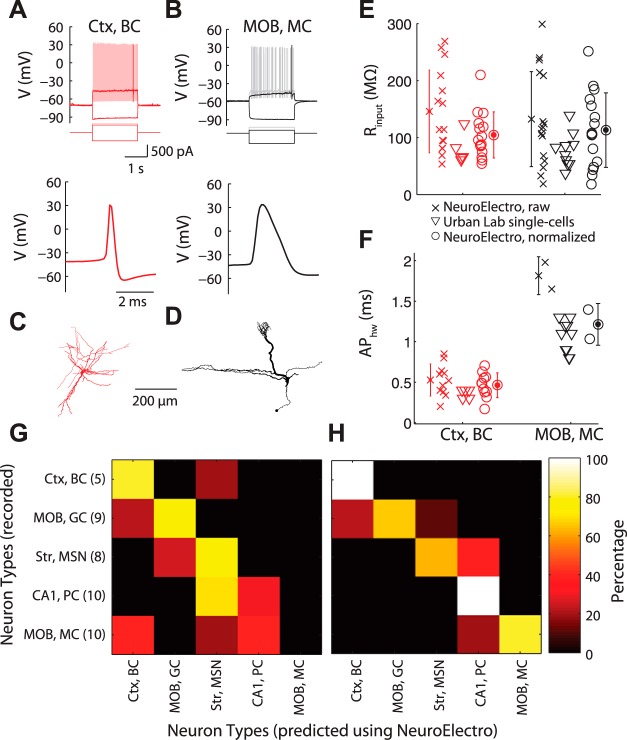
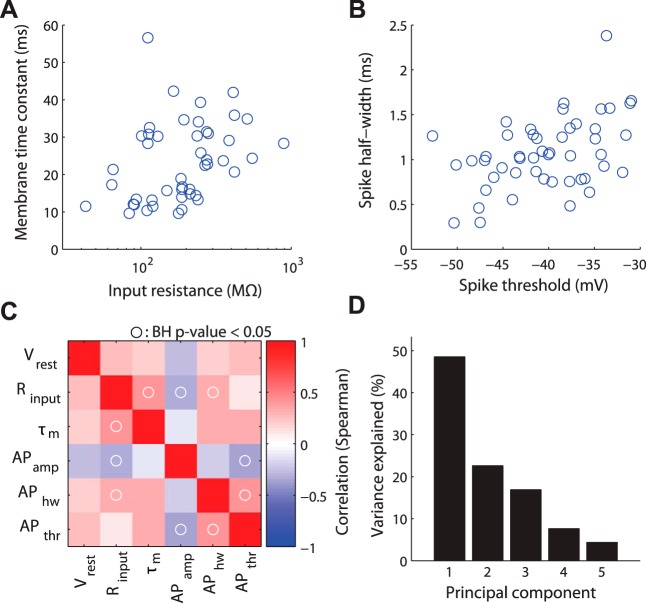
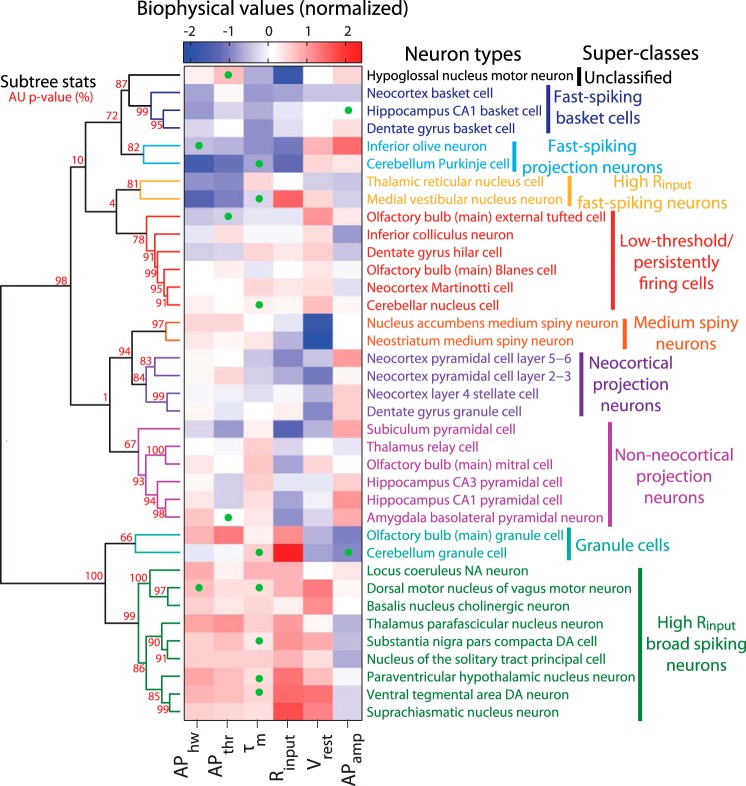
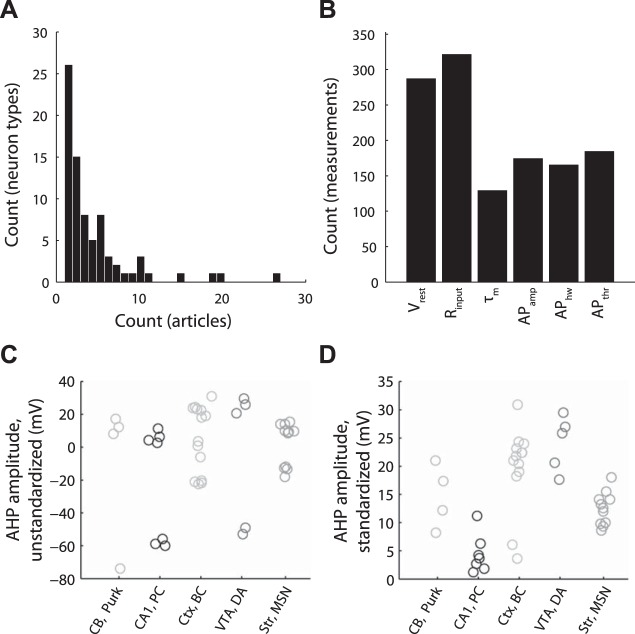
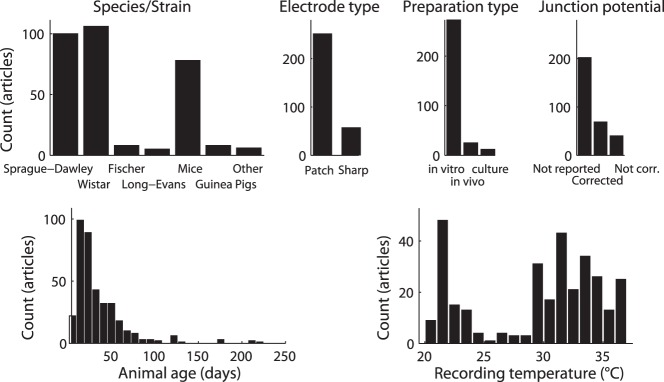
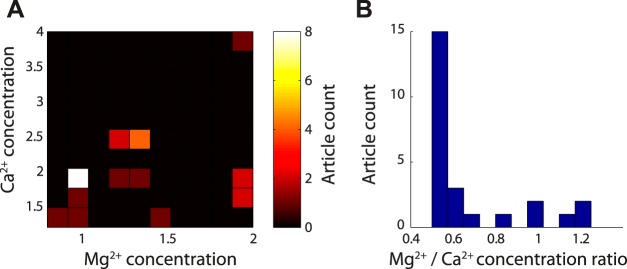
For decades, neurophysiologists have characterized the biophysical properties of a rich diversity of neuron types. However, identifying common features and computational roles shared across neuron types is made more difficult by inconsistent conventions for collecting and reporting biophysical data. Here, we leverage NeuroElectro, a literature-based database of electrophysiological properties (www.neuroelectro.org), to better understand neuronal diversity, both within and across neuron types, and the confounding influences of methodological variability. We show that experimental conditions (e.g., electrode types, recording temperatures, or animal age) can explain a substantial degree of the literature-reported biophysical variability observed within a neuron type. Critically, accounting for experimental metadata enables massive cross-study data normalization and reveals that electrophysiological data are far more reproducible across laboratories than previously appreciated. Using this normalized dataset, we find that neuron types throughout the brain cluster by biophysical properties into six to nine superclasses. These classes include intuitive clusters, such as fast-spiking basket cells, as well as previously unrecognized clusters, including a novel class of cortical and olfactory bulb interneurons that exhibit persistent activity at theta-band frequencies.

Keywords: databases; electrophysiology; intrinsic membrane properties; neuroinformatics; neuron biophysics; neuron diversity; text mining.


Figures

Fig. 1.
Fig. 1.
Schematic of NeuroElectro database construction and example electrophysiological measurements. A: semiautomated text-mining algorithms were applied to journal articles to extract neuron type-specific biophysical measurements and experimental conditions. BG: example electrophysiological measurements extracted from the research literature for cerebellar Purkinje cells, CA1 pyramidal cells, cortical basket cells, ventral tegmental area dopaminergic cells, and striatal medium spiny neurons (abbreviated as CB, Purk; CA1, PC; Ctx, BC; VTA, DA; and Str, MSN). Vrest, resting membrane potential; Rinput, resistance input; τm, membrane time constant; APamp, APhw, and APthr, action potential amplitude, half-width, and threshold. Each circle denotes the value of the mean biophysical measurement value reported within an article.
Fig. 2.
Fig. 2.
Methodological differences significantly explains observed variability in literature-mined electrophysiological data. A: cartoon illustrating metadata-based NeuroElectro data normalization. B: example data showing how measured values of Rinput vary as a function of recording electrode type and animal age. C: variance explained by statistical models for each electrophysiological property when only neuron type information is used (black) and when neuron type plus all metadata attributes are used (red). Error bars indicate SD, computed from 90% bootstrap resamplings of the entire dataset. DF: example relationships between specific metadata predictors and variation in electrophysiological properties. Dots show model-adjusted electrophysiological measurements after accounting for specific differences across neuron types. F: refers to correction of liquid junction potential (“jxn”). Asterisks indicate population mean and error bars indicate SD. G: influence of individual metadata predictors in helping explain variance in specific electrophysiological properties. Heatmap values indicate relative improvement over the model that includes neuron type information only. Circles indicate where the regression model including a metadata attribute was statistically more predictive than the model with neuron type information alone (P < 0.05, ANOVA). PrepType label indicates in vitro vs. in vivo. H: example data before (black) and after using statistical models to adjust for differences in metadata among electrophysiological measurements (red). Measurements become less variable and skewed after adjustment for methodological differences.
Fig. 3.
Fig. 3.
Direct comparison of NeuroElectro measurements to de novo recordings. A and B: representative recordings of a neocortical basket cell (Ctx, BC; A) and a main olfactory bulb mitral cell (MOB, MC; B), showing responses to hyperpolarizing, rheobase, and suprathreshold current injections (top), and action potential waveform (bottom). C and D: morphologies for cells in A and B. E and F: database measurements for mitral and basket cells before (crosses) and after (circles) metadata normalization and corresponding Urban Lab single cell measurements (triangles). Error bars indicate SD, computed across database measurements within a neuron type. G and H: confusion matrices highlighting classification of each recorded single cell to corresponding aggregate NeuroElectro neuron type for the raw (G) or metadata-normalized (H) NeuroElectro dataset. Matrix y-axis indicates recorded neuron identity and number within parentheses indicates n of recorded single cells per neuron type. The x-axis indicates the predicted neuron type based on biophysical similarity to NeuroElectro (i.e., perfect classification is a diagonal along matrix). MOB, GC, main olfactory bulb granule cell.
Fig. 4.
Fig. 4.
Exploring correlations between biophysical properties. A and B: example data showing pairwise correlations among biophysical properties. Each data point corresponds to measurements from a single neuron type (after averaging observations collected across multiple studies and adjusting for experimental condition differences). C: correlation matrix of biophysical properties (Spearman's correlation). Circles indicate where correlation of biophysical properties was statistically significant (P < 0.05 after Benjamini-Hochberg false discovery rate correction). D: variance explained across probabilistic principal components of electrophysiological correlation matrix in C.
Fig. 5.
Fig. 5.
Hierarchical clustering of diverse neuron types on the basis of biophysical similarity. Neuron types sorted in order of biophysical similarity (similarity indicated by levels of dendrogram; dendrogram linkages computed using Ward's method and Euclidean distances). Heatmap values indicate observed neuron type-specific electrophysiological measurements, red (blue) values indicate large (small) values relative to mean across neuron types. Statistical consistency of dendrogram subtrees calculated via bootstrap resampling [red values indicate approximately unbiased (AU) P values (see materials and methods); P values rounded to nearest integer for visualization]. Dendrogram subtrees are grouped into neuron type superclasses indicated by text coloring (and are otherwise black) based on P values and visual inspection. Only neuron types with measurements defined by at least three articles and with at least 4 (of the 6 total) biophysical properties reported were used in this analysis. Probabalistic principal component analysis (PCA) was used to impute unobserved measurements, indicated via green dots on heatmap.
Fig. A1.
Fig. A1.
Distribution of neuron types and electrophysiological properties represented in NeuroElectro and illustration of electrophysiological property standardization. A: frequency histogram of distribution of neuron types vs. number of articles containing information about each neuron type. B: count of unique measurements of the 6 electrophysiological properties explored in this article. C and D: illustration of manual electrophysiological property standardization for NeuroElectro measurements extracted from literature. Example afterhyperpolarization (AHP) amplitude measurements before (C) and after standardization (D) to a common calculation definition. Neurons plotted are cerebellar Purkinje cells, CA1 pyramidal cells, cortical basket cells, ventral tegmental area dopaminergic cells, and striatal medium spiny neurons (abbreviated as Purk; CA1, pyr; Ctx, bskt; VTA, DA; and Str, MSN; respectively). Each circle denotes the value of the mean electrophysiological measurement reported within an article.
Fig. A2.
Fig. A2.
Histograms of methodological variability in neurophysiology literature reflected within the NeuroElectro database.
Fig. A3.
Fig. A3.
Quantification of Mg2+ and Ca2+ recording solution concentrations among articles in quality control subset. A: 2-dimensional histogram of Mg2+ and Ca2+ recording solution concentrations, reported in mM. The most commonly reported concentration pair is 1 mM Mg2+ and 2 mM Ca2+. B: same as A, but reported as ratio of Mg2+ and Ca2+ concentration; n = 27 articles quantified; 2 articles not shown since in vivo recording conditions were used and no external recording solution was reported.
Fig. A4.
Fig. A4.
Compilation of different overall methods for calculating electrophysiological properties from the sample of curated articles in the quality control (QC) audit. AF: pie charts and labels indicate breakdown of electrophysiological calculation methodology and n indicates number of property measurements found in sample. Label “unreported” indicates that no specific methodological description could be found; n = 27 articles quantified in QC subset. A: resting membrane potential (Vrest), label “spontaneously active pseudo-Vrest method” indicates methodology for quantifying Vrest in spontaneously active neurons. B: input resistance (Rinput), label “leak method” indicates method for calculating Rinput based on leak current. C: membrane time constant (τm), label “peeling method to mitigate Ih” indicates method calculating τm that corrects for sag current influence, label “Cs+” indicates the use of cesium ions in the electrode pipette solution. D: action potential half-width (APhw). Labels indicate different protocols for eliciting spikes from which APhw is calculated. By definition, all APhw measurements have been quantified as AP full-width at half-maximal amplitude, usually from the first evoked AP in train. E: action potential amplitude (APamp). Pie charts indicate methodology for quantifying APamp (left) or protocol used to elicit action potentials (right). Quantification labels indicate whether APamp is defined as the difference between AP threshold and peak or Vrest and AP peak. F: action potential threshold (APthr), label “max inflection point” indicates identification of action potential threshold via 2nd derivative of voltage.
Fig. A5.
Fig. A5.
Validation of NeuroElectro database measurements with collection of raw data. A: representative targeted recording of a hippocampal CA1 pyramidal cell (“CA1, PC”), showing anatomical position and morphological reconstruction (left), response to hyperpolarizing and depolarizing rheobase and suprathreshold step current injections (middle), and action potential waveform (right). Anatomical scale bar = 200 μm. BD: same as A for main olfactory bulb mitral cell (B; “MOB, MC”), main olfactory bulb granule cell (C; “MOB, GC”), neocortical basket cell (D; “Ctx, BC”), and striatal medium spiny neuron (E; “Str, MSN”). F: summary of targeted in vitro recordings and comparison to text-mined, metadata-adjusted values from NeuroElectro. D, dorsal; P, posterior; M, medial; A, anterior. Morphological reconstructions (except the representative granule cell) have been moderately thickened to aid visualization of thinner processes.
Fig. A6.
Fig. A6.
Expanded analysis of correlations among electrophysiological properties. A: Benjamini-Hochberg adjusted P values for pairwise electrophysiological property correlation matrix shown in Fig. 4. B and C: coefficients corresponding to the first (B) and second (C) probabilistic principal component (pPC). D: projection of neuron types onto space defined by first and second pPCs. Note that the first pPC qualitatively reflects the axis of electrotonically small (left) vs. large (right) neuron types, while the second pPC qualitatively reflects the axis of basal excitability of neuron types, separating hyperpolarized (bottom) from depolarized (top) resting membrane potentials.
Fig. A7.
Fig. A7.
Hierarchical clustering of neuron types, without first normalizing for differences in experimental metadata. Same as Fig. 5, but computed for biophysical data without first adjusting for differences in experimental conditions. Neuron types sorted in order of biophysical similarity (similarity indicated by levels of dendrogram; dendrogram linkages computed using Ward's method and Euclidean distances). Heatmap values indicate observed neuron type-specific electrophysiological measurements, and red (blue) values indicate large (small) values relative to mean across neuron types. Only neuron types with measurements defined by at least three articles and with at least 4 (of the 6 total) biophysical properties reported were used in this analysis. Probabalistic PCA was used to impute unobserved measurements, indicated via green dots on heatmap.
Fig. A8.
Fig. A8.
Influence of dataset size vs. predictive power of metadata for explaining electrophysiological measurement variability. Panels show different electrophysiological properties and lines show explanatory power of statistical model when using neuron type information only (black, solid line) or neuron type plus all metadata (grey, dashed line) as a function of randomly subsampling the original dataset to smaller sizes (on abscissa). Original dataset size indicated by subsample fraction = 1.0. Shaded lines indicate SD when resampling the dataset 25 times per subsampling size. Note that as dataset is subsampled to smaller sizes, explanatory power of the model that includes metadata is not greater than the model that includes neuron type information only.

References

    1. Akil H, Martone ME, Van Essen DC. Challenges and opportunities in mining neuroscience data. Science 331: 708–712, 2011. - PMC - PubMed
    1. Altschul SF, Gish W, Miller W, Myers EW, Lipman DJ. Basic local alignment search tool. J Mol Biol 215: 403–410, 1990. - PubMed
    1. Ambert KH, Cohen AM. Text-mining and neuroscience. Int Rev Neurobiol 103: 109–132, 2012. - PubMed
    1. Ascoli GA, Alonso-Nanclares L, Anderson SA, Barrionuevo G, Benavides-Piccione R, Burkhalter A, Buzsaki G, Cauli B, DeFelipe J, Fairen A, Feldmeyer D, Fishell G, Fregnac Y, Freund TF, Gardner D, Gardner EP, Goldberg JH, Helmstaedter M, Hestrin S, Karube F, Kisvarday ZF, Lambolez B, Lewis DA, Marin O, Markram H, Munoz A, Packer A, Petersen CC, Rockland KS, Rossier J, Rudy B, Somogyi P, Staiger JF, Tamas G, Thomson AM, Toledo-Rodriguez M, Wang Y, West DC, Yuste R. Petilla terminology: nomenclature of features of GABAergic interneurons of the cerebral cortex. Nat Rev Neurosci 9: 557–568, 2008. - PMC - PubMed
    1. Ascoli GA, Donohue DE, Halavi M. NeuroMorpho.Org: a central resource for neuronal morphologies. J Neurosci 27: 9247–9251, 2007. - PMC - PubMed

Publication types

Substances

LinkOut - more resources