. 2015 Mar 25;35(12):4973-82.
doi: 10.1523/JNEUROSCI.4000-14.2015.

Input-gain control produces feature-specific surround suppression

Affiliations

Input-gain control produces feature-specific surround suppression

Alexander R Trott et al. J Neurosci. .

Abstract

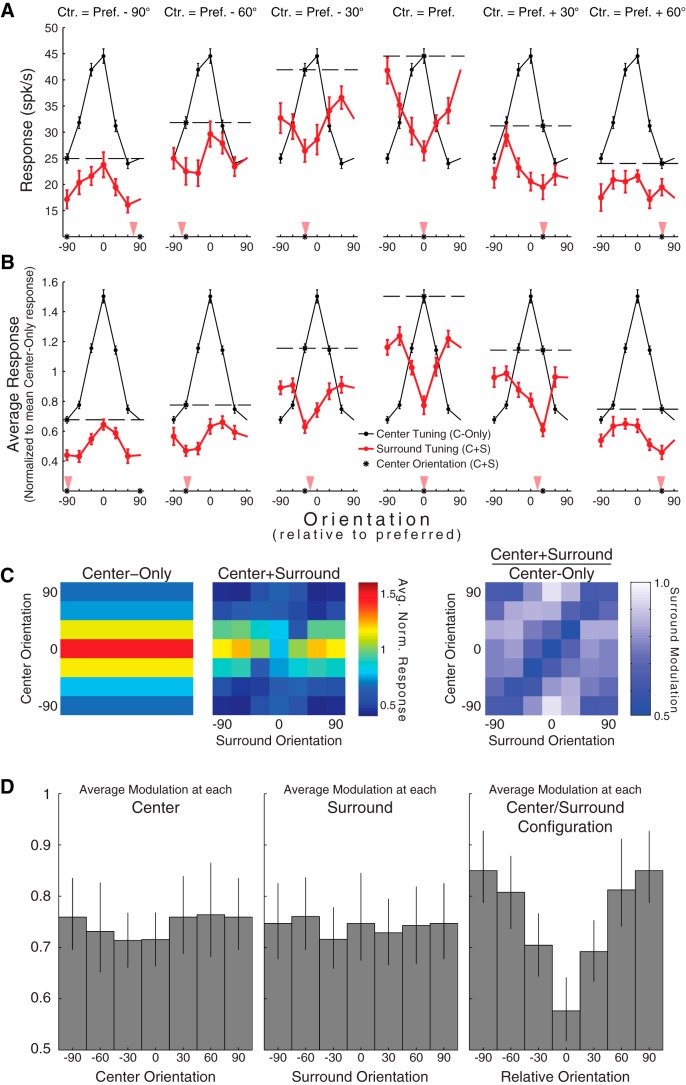
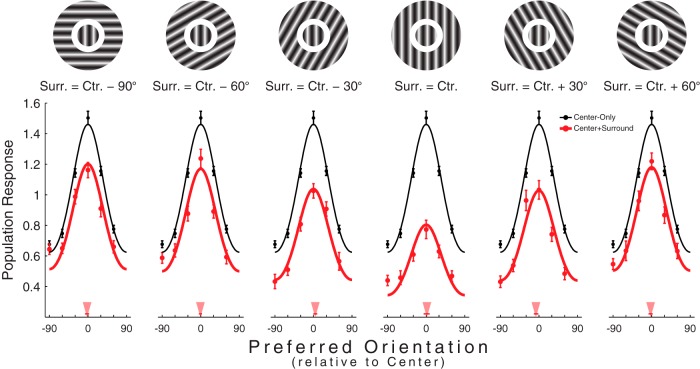
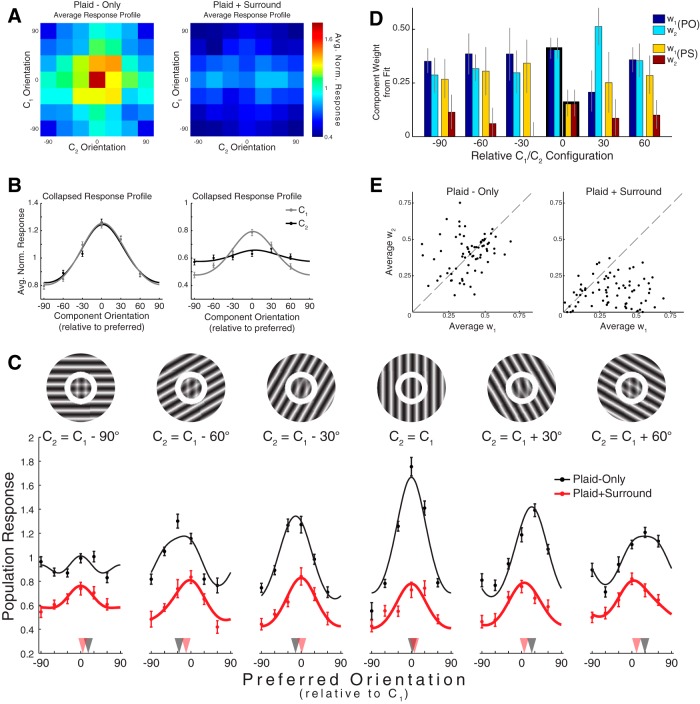
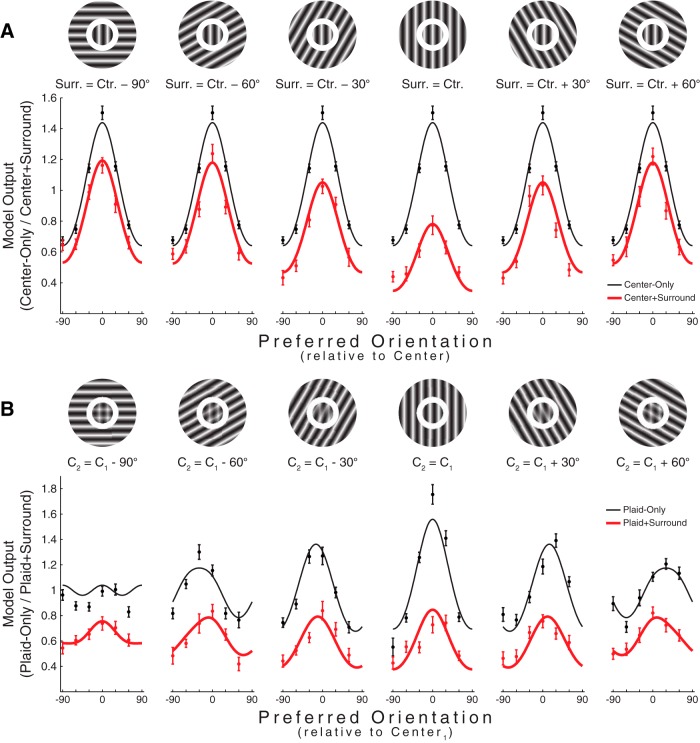
In primary visual cortex (V1), neuronal responses are sensitive to context. For example, responses to stimuli presented within the receptive field (RF) center are often suppressed by stimuli within the RF surround, and this suppression tends to be strongest when the center and surround stimuli match. We sought to identify the mechanism that gives rise to these properties of surround modulation. To do so, we exploited the stability of implanted multielectrode arrays to record from neurons in V1 of alert monkeys with multiple stimulus sets that more exhaustively probed center-surround interactions. We first replicated previous results concerning center-surround similarity using gratings representing all combinations of center and surround orientation. With this stimulus set, the surround simply scaled population responses to the center, such that the overall population tuning curve had the same shape and peak response. However, when the center contained two superimposed gratings (i.e., a visual "plaid"), one component of which always matched the surround orientation, suppression selectively affected the portion of the response driven by the matching center component, thereby producing shifts in the peak of the population orientation tuning curve. In effect, the surround caused neurons to respond predominantly to the component grating of the center plaid that was unmatched to the surround grating, as if by reducing the effective strength of whichever stimulus attributes were matched to the surround. These results provide key physiological support for theoretical models that propose feature-specific, input-gain control as the mechanism underlying surround suppression.

Keywords: efficient coding; input gain; surround suppression.


Figures

Figure 1.
Figure 1.
Tuning of surround suppression is sensitive to stimulus context. A, Tuning of an example MU to center orientation with no surround (black curve) and to surround orientation (red curves). Data points indicate mean ± SEM. Data plotted in black indicate the orientation tuning of the example MU to center orientation. These data serve as a visual reference and are identical across the six subplots. Data plotted in red indicate the orientation tuning of the MU to the orientation of the surround (with the center orientation fixed at a particular orientation). Each plot represents the surround tuning measured using a specific center orientation (indicated by the title and again as a black asterisk along the abscissa). Dashed line indicates the response to the relevant center when presented without a surround. Red triangles represent the orientation of the maximally suppressive surround, calculated from the mean vector of the difference between the center-only response (dashed line) and the surround tuning. B, Same as A, for population-averaged data. C (left), Same data in B, represented as response maps. C (right), Surround modulation map obtained by dividing (element-wise) the center+surround response map by the center-only response map. Smaller values indicate greater suppression. D, Collapsed representations of the modulation map, showing the average relationships between surround modulation and center (left), surround (middle), and relative center/surround orientations (right). The 95% confidence intervals (black) were obtained using bootstrapping.
Figure 2.
Figure 2.
Scaling of population responses. Population responses under each of the six relative center/surround configurations (a stimulus exemplifying the relevant configuration is illustrated above each subplot). Data points indicate mean ± SEM. Smooth black curves indicate the circular Gaussian fit to the center-only population response. Smooth red curves indicate the center-only Gaussian, scaled to best fit the center+surround data depicted in red. Red triangles point to the orientations of the mean vectors calculated from the center+surround population responses. The thin red lines superimposed on the triangles indicate the 95% confidence intervals obtained from the bootstrapping procedure described in the main text. Stimuli are shown for illustration and are not to scale.
Figure 3.
Figure 3.
Component-specific suppression with plaid center stimuli. A, Average response maps measured under the two surround conditions. B, Response maps in A, collapsed across stimulus dimensions, showing the average tuning to each of the center components with (right) and without (left) a surround. C, Population responses under each of the six relative configurations (a stimulus exemplifying the relevant configuration is illustrated above each subplot). Data points indicate mean ± SEM. Smooth curves indicate the results of the fitting procedure described in the main text (Eq. 2). Black (red) triangles point to the orientations of the mean vectors calculated from the plaid-only (plaid+surround) population responses. Stimuli are shown for illustration and are not to scale. D, Best-fitting component weights (Eq. 2). For fitting the two C2 = C1 population responses, w1 and w2 were constrained to be equal. The 95% confidence intervals (black) were obtained using bootstrapping. E, Scatter plots comparing the mean weight assigned to each component for fits to the plaid-only data (left) and fits to the plaid+surround data (right). Each data point corresponds to an individual multiunit.
Figure 4.
Figure 4.
Population responses predicted by input-gain model (Eq. 3). Continuous lines indicate model responses. Dots indicate actual data. A, Population responses under each of the six relative center/surround configurations, shown for the center-only (black) and center+surround (red) data. Conventions are identical to Figure 2. B, Same as A, for the plaid-only (black) and plaid+surround (red) data. Conventions are identical to Figure 3C.

References

    1. Allman J, Miezin F, McGuinness E. Direction- and velocity-specific responses from beyond the classical receptive field in the middle temporal visual area (MT) Perception. 1985;14:105–126. doi: 10.1068/p140105. - DOI - PubMed
    1. Bair W, Cavanaugh JR, Movshon JA. Time course and time-distance relationships for surround suppression in macaque V1 neurons. J Neurosci. 2003;23:7690–7701. - PMC - PubMed
    1. Barlow H. Sensory mechanisms, the reduction of redundancy, and intelligence. NPL Symposium on the Mechanization of Thought Process 535–539.1959.
    1. Benucci A, Saleem AB, Carandini M. Adaptation maintains population homeostasis in primary visual cortex. Nat Neurosci. 2013;16:724–729. doi: 10.1038/nn.3382. - DOI - PMC - PubMed
    1. Busse L, Wade AR, Carandini M. Representation of concurrent stimuli by population activity in visual cortex. Neuron. 2009;64:931–942. doi: 10.1016/j.neuron.2009.11.004. - DOI - PMC - PubMed

Publication types

LinkOut - more resources