. 2015 Mar 26;10(3):e0121117.
doi: 10.1371/journal.pone.0121117. eCollection 2015.

Dual RNA sequencing reveals the expression of unique transcriptomic signatures in lipopolysaccharide-induced BV-2 microglial cells

Affiliations

Dual RNA sequencing reveals the expression of unique transcriptomic signatures in lipopolysaccharide-induced BV-2 microglial cells

Amitabh Das et al. PLoS One. .

Abstract

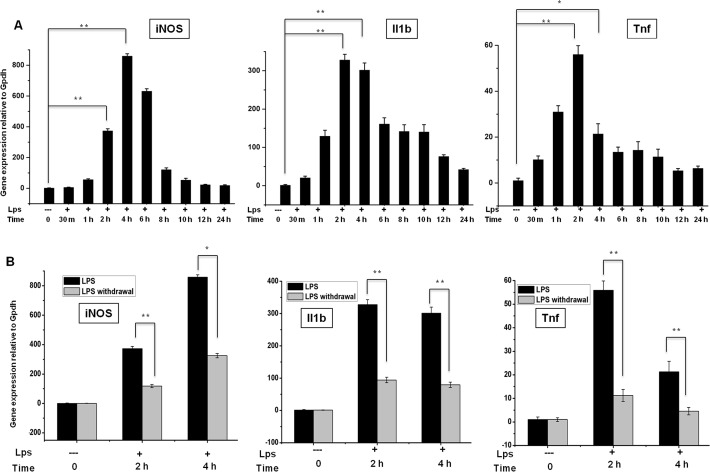
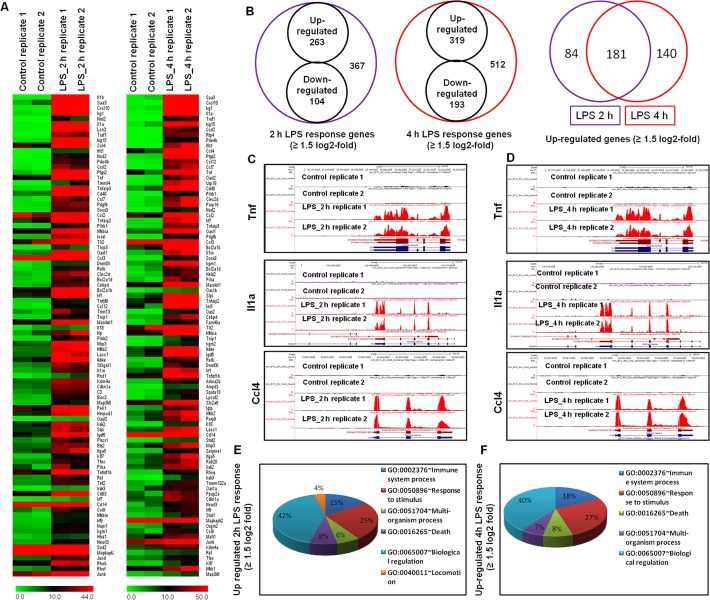
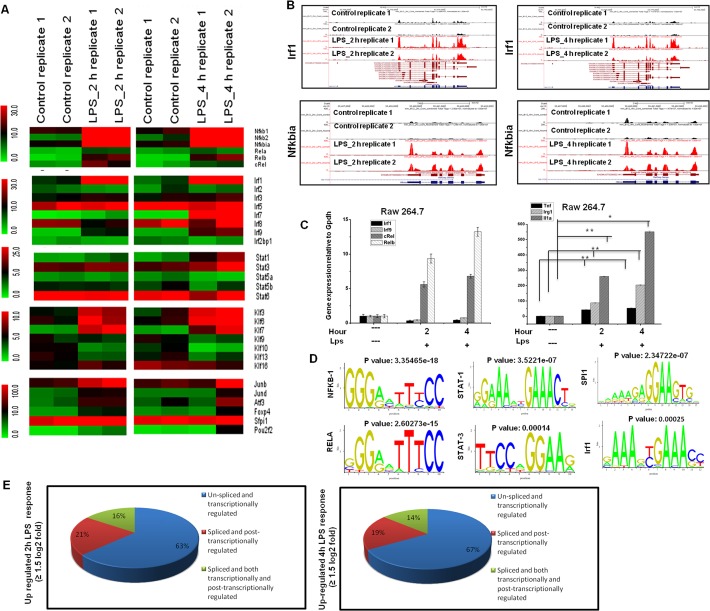
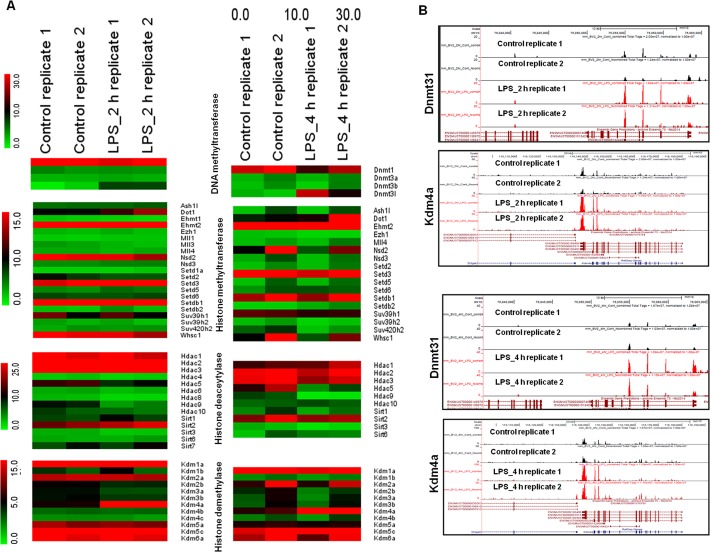
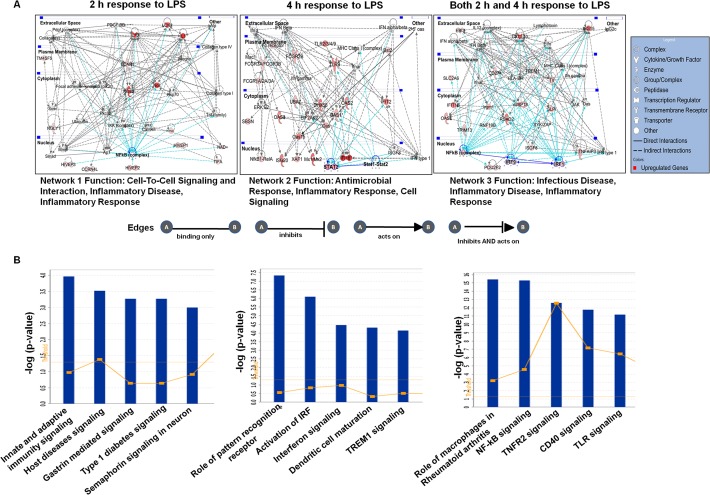
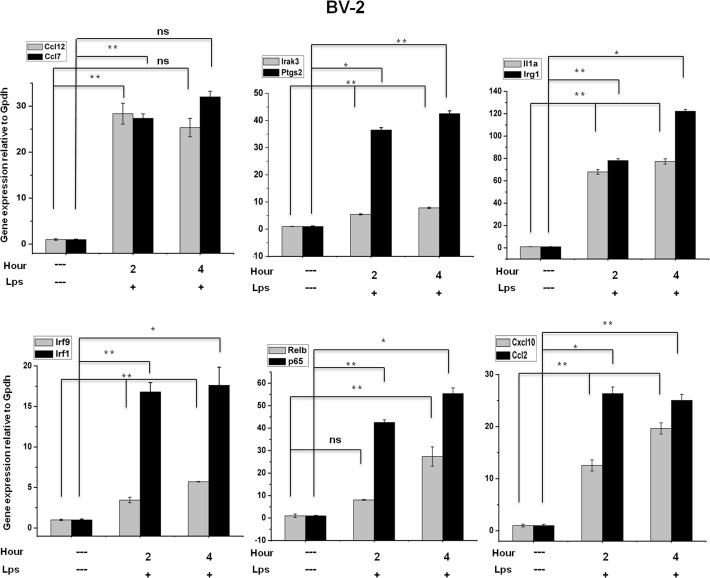
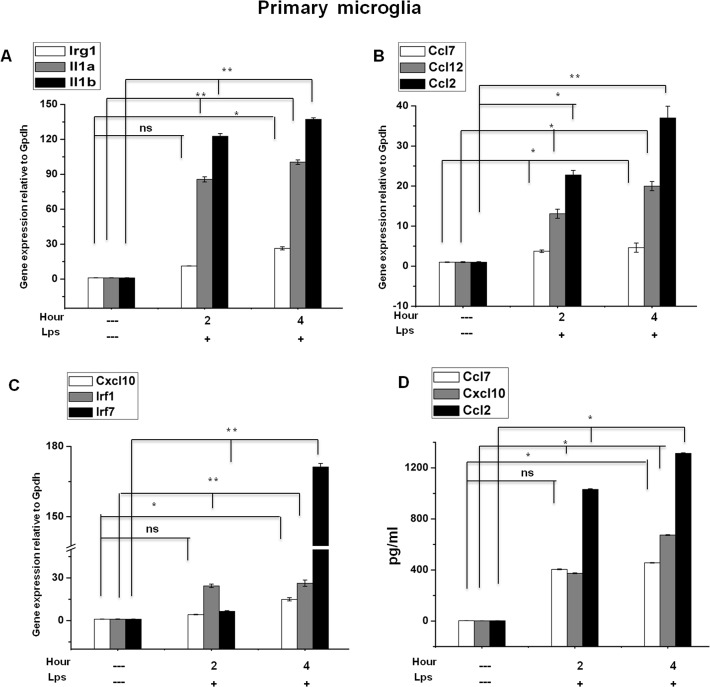
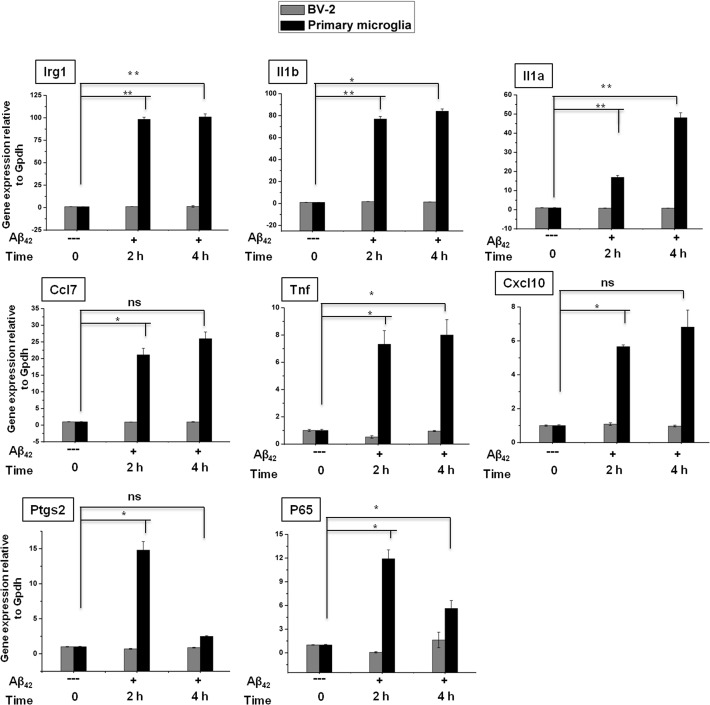
Microglial cells become rapidly activated through interactions with pathogens, and the persistent activation of these cells is associated with various neurodegenerative diseases. Previous studies have investigated the transcriptomic signatures in microglia or macrophages using microarray technologies. However, this method has numerous restrictions, such as spatial biases, uneven probe properties, low sensitivity, and dependency on the probes spotted. To overcome this limitation and identify novel transcribed genes in response to LPS, we used RNA Sequencing (RNA-Seq) to determine the novel transcriptomic signatures in BV-2 microglial cells. Sequencing assessment and quality evaluation showed that approximately 263 and 319 genes (≥ 1.5 log2-fold), such as cytokines and chemokines, were strongly induced after 2 and 4 h, respectively, and the induction of several genes with unknown immunological functions was also observed. Importantly, we observed that previously unidentified transcription factors (TFs) (irf1, irf7, and irf9), histone demethylases (kdm4a) and DNA methyltransferases (dnmt3l) were significantly and selectively expressed in BV-2 microglial cells. The gene expression levels, transcription start sites (TSS), isoforms, and differential promoter usage revealed a complex pattern of transcriptional and post-transcriptional gene regulation upon infection with LPS. In addition, gene ontology, molecular networks and pathway analyses identified the top significantly regulated functional classification, canonical pathways and network functions at each activation status. Moreover, we further analyzed differentially expressed genes to identify transcription factor (TF) motifs (-950 to +50 bp of the 5' upstream promoters) and epigenetic mechanisms. Furthermore, we confirmed that the expressions of key inflammatory genes as well as pro-inflammatory mediators in the supernatants were significantly induced in LPS treated primary microglial cells. This transcriptomic analysis is the first to show a comparison of the family-wide differential expression of most known immune genes and also reveal transcription evidence of multiple gene families in BV-2 microglial cells. Collectively, these findings reveal unique transcriptomic signatures in BV-2 microglial cells required for homeostasis and effective immune responses.


Conflict of interest statement

Competing Interests: The authors have declared that no competing interests exist.

Figures

Fig 1
Fig 1. Inflammatory gene expression patterns in response to LPS stimulation and after LPS withdrawal in BV-2 microglial cells.
(A, B) Quantitative real-time reverse transcriptase-PCR analysis of inflammatory gene expression in BV-2 microglial cells stimulated with LPS (10 ng/ml) and after LPS was washed away (LPS withdrawal). The expression of inflammatory genes was significantly up-regulated in cells treated with LPS and significantly decreased after the removal of LPS compared with untreated cells (*P<0.05 and **P<0.001) at the indicated times. Gene expression was normalized to GAPDH transcript levels. The data represent three independent experiments. The values are shown as the means ± SD of triplicate wells.
Fig 2
Fig 2. RNA-Seq analysis reveals that LPS-stimulated pro-inflammatory gene expression in BV-2 microglial cells.
(A) Heat map representing RNA-Seq gene expression of up-regulated (≥ 1.5 log2-fold) inflammatory genes at 2 and 4 h after LPS stimulation in BV-2 microglia cells compared with controls. (B) Venn diagram displaying the number of inducible or repressible (≥ 1.5 log2-fold) genes after LPS stimulation in BV-2 microglia cells. (C, D) UCSC Browser images representing normalized RNA-Seq read densities at 2 and 4 h after LPS stimulation in BV-2 microglia cells compared with controls. (E, F) Gene Ontology analysis of functional annotations associated with up-regulated genes at 2 and 4 h after LPS stimulation in BV-2 microglia.
Fig 3
Fig 3. Transcriptomic analysis of selected TF families in BV-2 microglial cells.
(A) Heat map represents differential expression of TF families of nfκb, irf, stat, klf, and other genes at 2 and 4 h after LPS stimulation in BV-2 microglial cells. (B) UCSC Browser images representing normalized RNA-Seq read densities for TF expression at 2 and 4 h after LPS stimulation in BV-2 microglia cells compared with controls. (C) Quantitative real-time reverse transcriptase-PCR analysis of TF and inflammatory gene expression in RAW 264.7 mouse macrophage cells stimulated with LPS (10 ng/ml) at the indicated times. (D) Patterns of transcription factor motif enrichments within the promoters of the genes in LPS-stimulated BV-2 microglia cells. (E) Transcriptional and post-transcriptional regulatory effects on overall transcript output in LPS-stimulated BV-2 microglial cells.
Fig 4
Fig 4. Epigenetic mechanisms for LPS-stimulated BV-2 microglial cells.
(A) RNA-Seq analysis of DEGs encoding key enzymes in epigenetic regulation. The heat maps display family-wide gene collections encoding DNA/histone methyltransferases, histone deacetylases and histone demethylases. (B) UCSC Browser images representing normalized RNA-Seq read densities for DNA methyltransferases and histone demethylases at 2 and 4 h after LPS stimulation in BV-2 microglial cells compared with controls.
Fig 5
Fig 5. Top network and canonical pathway analyses at each time point (2 h and 4 h) in LPS-stimulated BV-2 microglial cells.
(A) Ingenuity Bioinformatics pathway analysis of gene network with connections to nf-κb, stat1-stat2, irf1 and irf9 and differentially expressed genes in LPS-stimulated BV-2 microglia cells. (B) The most highly represented canonical pathways for differentially expressed genes in BV-2 microglial cells.
Fig 6
Fig 6. Confirmation of differentially expressed genes by quantitative reverse transcription-polymerase chain reaction in BV-2 microglial cells.
ccl12, ccl7, irak3, ptgs2, il1a, irg1, irf9, irf1, relb, p65, cxcl10, and ccl2 genes were significantly up-regulated in LPS-treated BV-2 microglia cells. Gene expression was normalized to the GAPDH transcript levels. *P<0.05, **P<0.001 and ns stands for no significant difference compared with control. The data represent three independent experiments.
Fig 7
Fig 7. Confirmation of differentially expressed genes and release of pro-inflammatory mediators in primary microglial cells.
(A, B, and C) irg1, il1a, il1b, ccl7, ccl12, ccl2, cxcl10, irf1, and irf7 genes were significantly up-regulated in LPS (10 ng/mL) treated primary microglia cells. Gene expression was normalized to the GAPDH transcript levels. (D) Primary microglial cell culture supernatants of LPS (10 ng/mL) treated cells were subjected to ELISA to detect the levels of pro-inflammatory cytokines/chemokines. Therefore, primary microglial cells were treated with LPS for 2 h and 4 h, followed by quantification of ccl2, ccl7, and cxcl10 levels. Values are given in pg/ml. Means and standard deviations of the mean of three independent experiments are shown (*P value <0.05, **P value <0.001, ns stands for no significant difference compared with control).
Fig 8
Fig 8. Effect of Aβ42 on the expressions of inflammatory mediators in microglial cells.
Quantitative real-time reverse transcriptase-PCR analysis of inflammatory gene expression in BV-2 and primary microglial cells stimulated with Aβ42. The expression of inflammatory genes were significantly up-regulated in primary microglial cells treated with Aβ42 compared with untreated cells (*P<0.05, **P<0.001 and ns stands for no significant difference compared with control) at the indicated times. Gene expression was normalized to GAPDH transcript levels. The data represent three independent experiments. The values are shown as the means ± SD of triplicate wells.

References

    1. Nimmo AJ, Vink R. Recent patents in CNS drug discovery: the management of inflammation in the central nervous system. Recent Pat CNS Drug Discov. 2009;4: 86–95. - PubMed
    1. Liu B, Hong JS. Role of microglia in inflammation-mediated neurodegenerative diseases: mechanisms and strategies for therapeutic intervention. J Pharmacol Exp Ther. 2003;304: 1–7. - PubMed
    1. Graeber MB, Streit WJ. Microglia: biology and pathology. Acta Neuropathol. 2010;119: 89–105. 10.1007/s00401-009-0622-0 - DOI - PubMed
    1. Block ML, Zecca L, Hong JS. Microglia-mediated neurotoxicity: uncovering the molecular mechanisms. Nat Rev Neurosci. 2007;8: 57–69. - PubMed
    1. Lerouge I, Vanderleyden J. O-antigen structural variation: mechanisms and possible roles in animal/plant-microbe interactions. FEMS Microbiol Rev. 2002;26: 17–47. - PubMed

Publication types

MeSH terms

LinkOut - more resources