. 2015 Jun;31(4):359-74.
doi: 10.3109/02656736.2015.1005178. Epub 2015 Mar 26.

Magnetic nanoparticle hyperthermia enhances radiation therapy: A study in mouse models of human prostate cancer

Affiliations

Magnetic nanoparticle hyperthermia enhances radiation therapy: A study in mouse models of human prostate cancer

Anilchandra Attaluri et al. Int J Hyperthermia. 2015 Jun.

Abstract

Purpose: We aimed to characterise magnetic nanoparticle hyperthermia (mNPH) with radiation therapy (RT) for prostate cancer.

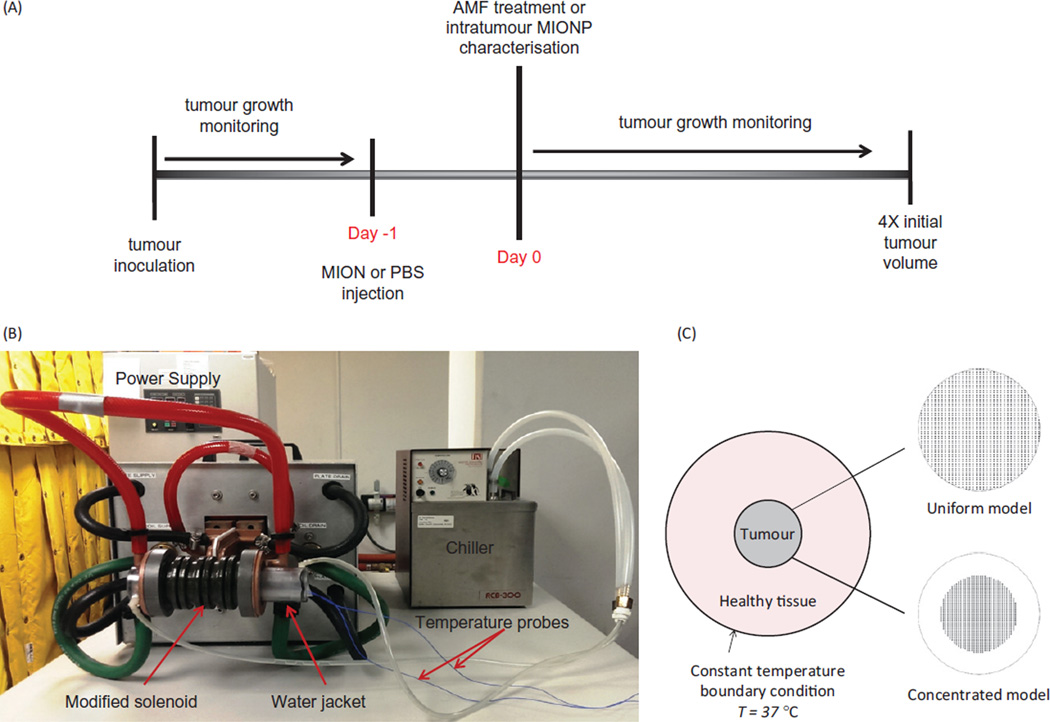
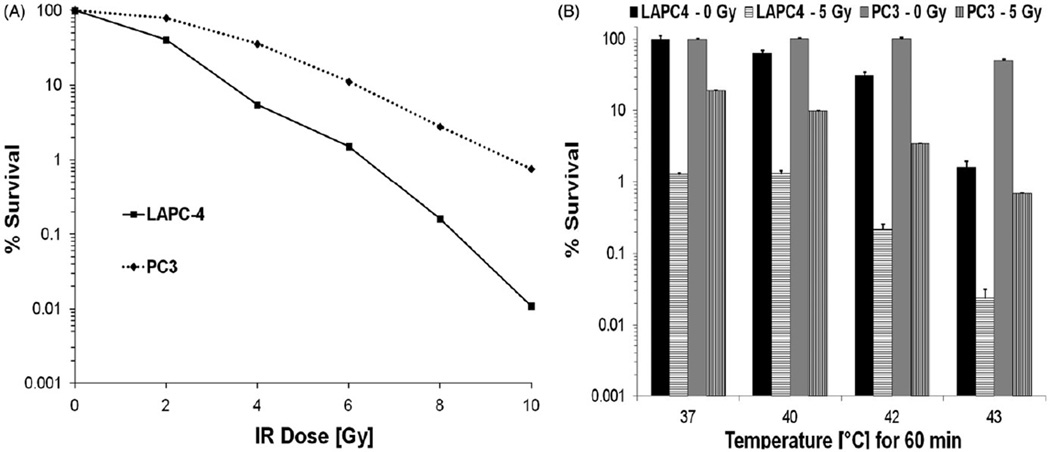
Methods: Human prostate cancer subcutaneous tumours, PC3 and LAPC-4, were grown in nude male mice. When tumours measured 150 mm3 magnetic iron oxide nanoparticles (MIONPs) were injected into tumours to a target dose of 5.5 mg Fe/cm3 tumour, and treated 24 h later by exposure to alternating magnetic field (AMF). Mice were randomly assigned to one of four cohorts to characterise (1) intratumour MIONP distribution, (2) effects of variable thermal dose mNPH (fixed AMF peak amplitude 24 kA/m at 160 ± 5 kHz) with/without RT (5 Gy), (3) effects of RT (RT5: 5 Gy; RT8: 8 Gy), and (4) fixed thermal dose mNPH (43 °C for 20 min) with/without RT (5 Gy). MIONP concentration and distribution were assessed following sacrifice and tissue harvest using inductively coupled plasma mass spectrometry (ICP-MS) and Prussian blue staining, respectively. Tumour growth was monitored and compared among treated groups.

Results: LAPC-4 tumours retained higher MIONP concentration and more uniform distribution than did PC3 tumours. AMF power modulation provided similar thermal dose for mNPH and combination therapy groups (CEM43: LAPC-4: 33.6 ± 3.4 versus 25.9 ± 0.8, and PC3: 27.19 ± 0.7 versus 27.50 ± 0.6), thereby overcoming limitations of MIONP distribution and yielding statistically significant tumour growth delay.

Conclusion: PC3 and LAPC-4 tumours represent two biological models that demonstrate different patterns of nanoparticle retention and distribution, offering a model to make comparisons of these effects for mNPH. Modulating power for mNPH offers potential to overcome limitations of MIONP distribution to enhance mNPH.

Keywords: Hyperthermia; magnetic nanoparticles; prostate cancer; radiation therapy; radiosensitiser.


Conflict of interest statement

Declaration of interest

R. Ivkov is an inventor on several issued and pending patents that disclose nanoparticle formulations for imaging and hyperthermia. All patents on which R. Ivkov is an inventor are assigned to either Johns Hopkins University or Aduro Biotech. All other authors report no conflicts of interest.

Figures

Figure 1
Figure 1
(A) Schematic of the study design for therapy of either PC3 or LAPC-4 tumours in mice. (B) Photograph of experimental equipment used to perform mNPH treatments in mouse tumours. (C) Schematic of the computational model of healthy tissue and tumour with (1) uniform nanoparticle distribution, and (2) concentrated nanoparticle distribution.
Figure 2
Figure 2
(A) In vitro measure of surviving fraction of PC3 and LAPC-4 cells exposed to ionising radiation determined from clonogenic survival assays relative to untreated controls. Each data point represents an average of triplicate measurements. Error bars (standard error) do not appear on the log scale. (B) Surviving fraction of PC3 and LAPC-4 cells were exposed to the indicated (water bath) temperature for 60 min ± a 5-Gy dose of ionising radiation determined from clonogenic survival assays relative to untreated controls. Histogram data represent an average of triplicate measurements. Error bars represent standard error (95% CL).
Figure 3
Figure 3
Representative tumour sections harvested from mice stained with Perl’s reagent (Prussian blue) highlighting iron oxide (magnetic iron oxide) distribution.
Figure 4
Figure 4
(A) An example of temporal temperature rise during a constant power mNPH. (B) Histogram plot showing LAPC-4 and PC3 tumour response to constant power mNPH therapy. Bars represent mean time to progress to 4 × initial volume (at time of treatment). Tumour growth delay comparison of untreated control, and constant power mNPH, was performed using t-test with unequal variance. Two of the eight mice in the PC3-24kA/m group showed complete response (no tumour) at 60 days. For comparison purposes 60 days was considered as the time to 4 × for those two mice. (C) Kaplan-Meier plot showing the outcome of varied combinations of mNPH (constant power) for both PC3 and LAPC-4 tumours.
Figure 5
Figure 5
(A) Representative four-point thermometry of mice treated with power-modulated mNPH. Single-point temperatures were measured at one-second intervals with optical fiber temperature probes placed into the tumour (Tumour), in a similar location subcutaneously on the opposite thigh (Contralateral) to tumour, inserted in the rectum (Rectal), and affixed to the surface of the water jacket (Water Jacket). (B) Kaplan–Meier plot summarizing outcome of power-modulated mNPH ± RT (5 Gy), and RT (RT5 and RT8) in LAPC-4 tumours. (C) As in B, but for PC3 tumours. (D) Histogram plot showing LAPC-4 tumour response to therapy as in B. Bars represent mean time to progress to 4X initial volume (compared to time of treatment, t0). A tumour growth delay comparison between groups was performed using t-test with unequal variance. (E) As in D for PC3 tumours. Key for symbols used in figures: ns p>0.05; *p≤0.05; **p≤0.01; ***p≤0.001; ****p ≤ 0.0001.
Figure 6
Figure 6
(A) Temperature distribution of uniform distribution model after 60 min of heating at constant power of QP = 4.6 × 10⁵ W/m3. (B) As in A for concentrated distribution model. (C) Variation of tumour–tissue boundary temperature with time for uniform and concentrated distribution models under heating at constant power of QP = 4.6 × 10 W/m3.
Figure 7
Figure 7
(A) Temperature distribution of uniform distribution model after 60 min of heating at modulated power based on temperature feedback from (1) probe at tumour centre, (2) probe at halfway between tumour centre and tumour–tissue boundary, (3) probe at tumour–tissue boundary. (B) Same as A for concentrated model. (C) Variation of tumour–tissue boundary temperature with time for uniform distribution model under heating at modulated power based on temperature feedback from (1) at the tumour centre (Probe 1), (2) at the midpoint between tumour centre and tumour–tissue boundary (Probe 2); and, (3) at the tumour–tissue boundary (Probe 3). (D) Same as C for concentrated model.

References

    1. Sanda MG, Dunn RL, Michalski J, Sandler HM, Northouse L, Hembroff L, et al. Quality of life and satisfaction with outcome among prostate-cancer survivors. New Engl J Med. 2008;358:1250–1261. - PubMed
    1. Sundi D, Jeong BC, Lee SB, Han M. Optimizing the management of high-risk, localized prostate cancer. Korean J Urol. 2012;53:815–820. - PMC - PubMed
    1. Khor R, Williams S. Contemporary issues in radiotherapy for clinically Localized prostate cancer. Hematol Oncol Clin N Am. 2013;27:1137–1162. - PubMed
    1. Citrin D, Camphausen KA. Biomarkers for prostate cancer: Who will benefit from local treatment, who harbors occult systemic disease and who needs treatment at all? Biomark Med. 2013;7:823–825. - PMC - PubMed
    1. Horsman MR, Overgaard J. Hyperthermia: A potent enhancer of radiotherapy. Clin Oncol. 2007;19:418–426. - PubMed

Publication types

Substances