

Modulation of genetic associations with serum urate levels by body-mass-index in humans
- PMID: 25811787
- PMCID: PMC4374966
- DOI: 10.1371/journal.pone.0119752
Modulation of genetic associations with serum urate levels by body-mass-index in humans
Abstract
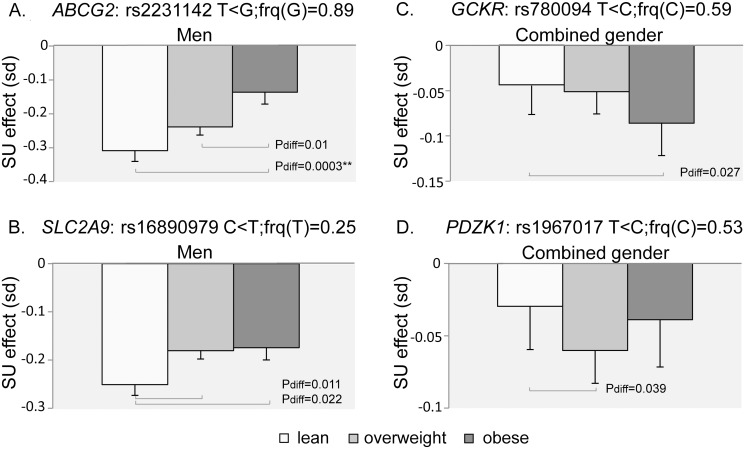
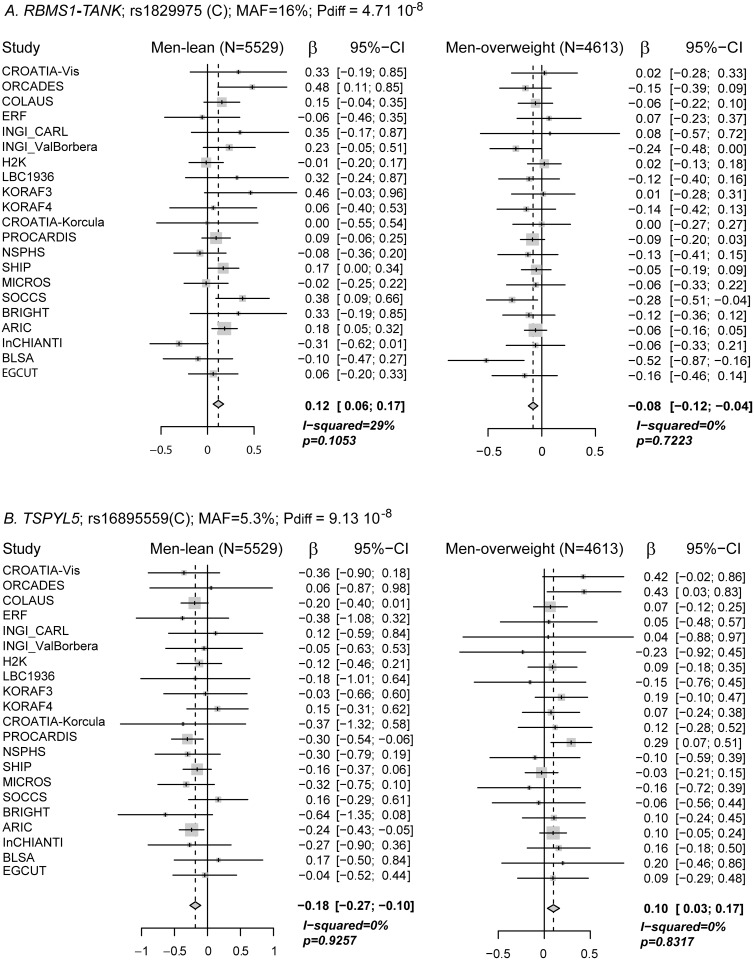
We tested for interactions between body mass index (BMI) and common genetic variants affecting serum urate levels, genome-wide, in up to 42569 participants. Both stratified genome-wide association (GWAS) analyses, in lean, overweight and obese individuals, and regression-type analyses in a non BMI-stratified overall sample were performed. The former did not uncover any novel locus with a major main effect, but supported modulation of effects for some known and potentially new urate loci. The latter highlighted a SNP at RBFOX3 reaching genome-wide significant level (effect size 0.014, 95% CI 0.008-0.02, Pinter= 2.6 x 10⁻⁸). Two top loci in interaction term analyses, RBFOX3 and ERO1LB-EDARADD, also displayed suggestive differences in main effect size between the lean and obese strata. All top ranking loci for urate effect differences between BMI categories were novel and most had small magnitude but opposite direction effects between strata. They include the locus RBMS1-TANK (men, Pdifflean-overweight= 4.7 x 10⁻⁸), a region that has been associated with several obesity related traits, and TSPYL5 (men, Pdifflean-overweight= 9.1 x 10⁻⁸), regulating adipocytes-produced estradiol. The top-ranking known urate loci was ABCG2, the strongest known gout risk locus, with an effect halved in obese compared to lean men (Pdifflean-obese= 2 x 10⁻⁴). Finally, pathway analysis suggested a role for N-glycan biosynthesis as a prominent urate-associated pathway in the lean stratum. These results illustrate a potentially powerful way to monitor changes occurring in obesogenic environment.
Conflict of interest statement
Figures
References
-
- Kutzing MK, Firestein BL. Altered uric acid levels and disease states. J Pharmacol Exp Ther. 2008; 324: 1–7. - PubMed
Publication types
MeSH terms
Substances
Grants and funding
- HHSN268201100009I/HL/NHLBI NIH HHS/United States
- N01 AG012100/AG/NIA NIH HHS/United States
- R01 HL059367/HL/NHLBI NIH HHS/United States
- HHSN268201100011I/HL/NHLBI NIH HHS/United States
- MR/K026992/1/MRC_/Medical Research Council/United Kingdom
- U01HG004402/HG/NHGRI NIH HHS/United States
- HHSN268201100006C/HL/NHLBI NIH HHS/United States
- MC_PC_U127561128/MRC_/Medical Research Council/United Kingdom
- C348/A12076/CRUK_/Cancer Research UK/United Kingdom
- BB/F019394/1/BB_/Biotechnology and Biological Sciences Research Council/United Kingdom
- R01 HL087641/HL/NHLBI NIH HHS/United States
- C348/A6361/CRUK_/Cancer Research UK/United Kingdom
- R01HL086694/HL/NHLBI NIH HHS/United States
- G0000657-53203/MRC_/Medical Research Council/United Kingdom
- HHSN268201100012C/HL/NHLBI NIH HHS/United States
- UL1RR025005/RR/NCRR NIH HHS/United States
- G9521010/MRC_/Medical Research Council/United Kingdom
- MC_PC_U127527198/MRC_/Medical Research Council/United Kingdom
- R01HL59367/HL/NHLBI NIH HHS/United States
- HHSN268201100010C/HL/NHLBI NIH HHS/United States
- UL1 RR025005/RR/NCRR NIH HHS/United States
- HHSN268201100008C/HL/NHLBI NIH HHS/United States
- HHSN268201100005G/HL/NHLBI NIH HHS/United States
- HHSN268201100008I/HL/NHLBI NIH HHS/United States
- HHSN268201100007C/HL/NHLBI NIH HHS/United States
- R01 MD009164/MD/NIMHD NIH HHS/United States
- 12076/CRUK_/Cancer Research UK/United Kingdom
- HHSN268201100011C/HL/NHLBI NIH HHS/United States
- R01 HL086694/HL/NHLBI NIH HHS/United States
- HHSN268200625226C/PHS HHS/United States
- U01 HG004402/HG/NHGRI NIH HHS/United States
- G9521010D/MRC_/Medical Research Council/United Kingdom
- 095831/WT_/Wellcome Trust/United Kingdom
- R01HL087641/HL/NHLBI NIH HHS/United States
- MC_PC_U127592696/MRC_/Medical Research Council/United Kingdom
- HHSN268201100005I/HL/NHLBI NIH HHS/United States
- MR/K018647/1/MRC_/Medical Research Council/United Kingdom
- MR/K006584/1/MRC_/Medical Research Council/United Kingdom
- HHSN268201100009C/HL/NHLBI NIH HHS/United States
- N01-AG-12100/AG/NIA NIH HHS/United States
- HHSN268201100005C/HL/NHLBI NIH HHS/United States
- G0700704/MRC_/Medical Research Council/United Kingdom
- HHSN268201100007I/HL/NHLBI NIH HHS/United States
LinkOut - more resources
Full Text Sources
Other Literature Sources
