

The study to understand the genetics of the acute response to metformin and glipizide in humans (SUGAR-MGH): design of a pharmacogenetic resource for type 2 diabetes
- PMID: 25812009
- PMCID: PMC4374872
- DOI: 10.1371/journal.pone.0121553
The study to understand the genetics of the acute response to metformin and glipizide in humans (SUGAR-MGH): design of a pharmacogenetic resource for type 2 diabetes
Abstract
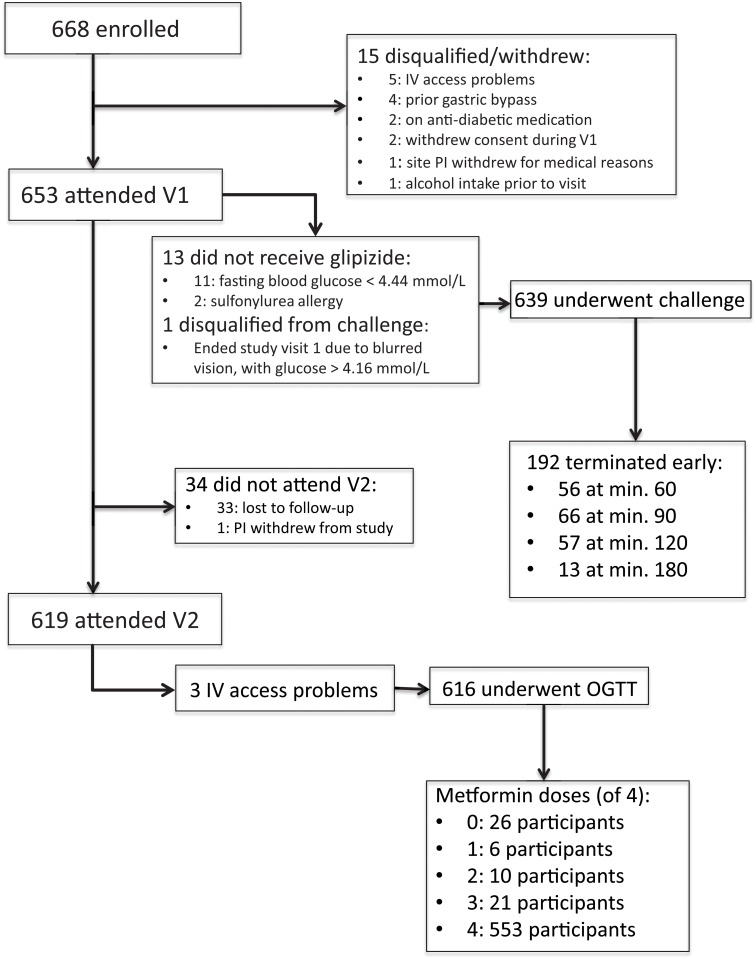
Objective: Genome-wide association studies have uncovered a large number of genetic variants associated with type 2 diabetes or related phenotypes. In many cases the causal gene or polymorphism has not been identified, and its impact on response to anti-hyperglycemic medications is unknown. The Study to Understand the Genetics of the Acute Response to Metformin and Glipizide in Humans (SUGAR-MGH, NCT01762046) is a novel resource of genetic and biochemical data following glipizide and metformin administration. We describe recruitment, enrollment, and phenotyping procedures and preliminary results for the first 668 of our planned 1,000 participants enriched for individuals at risk of requiring anti-diabetic therapy in the future.
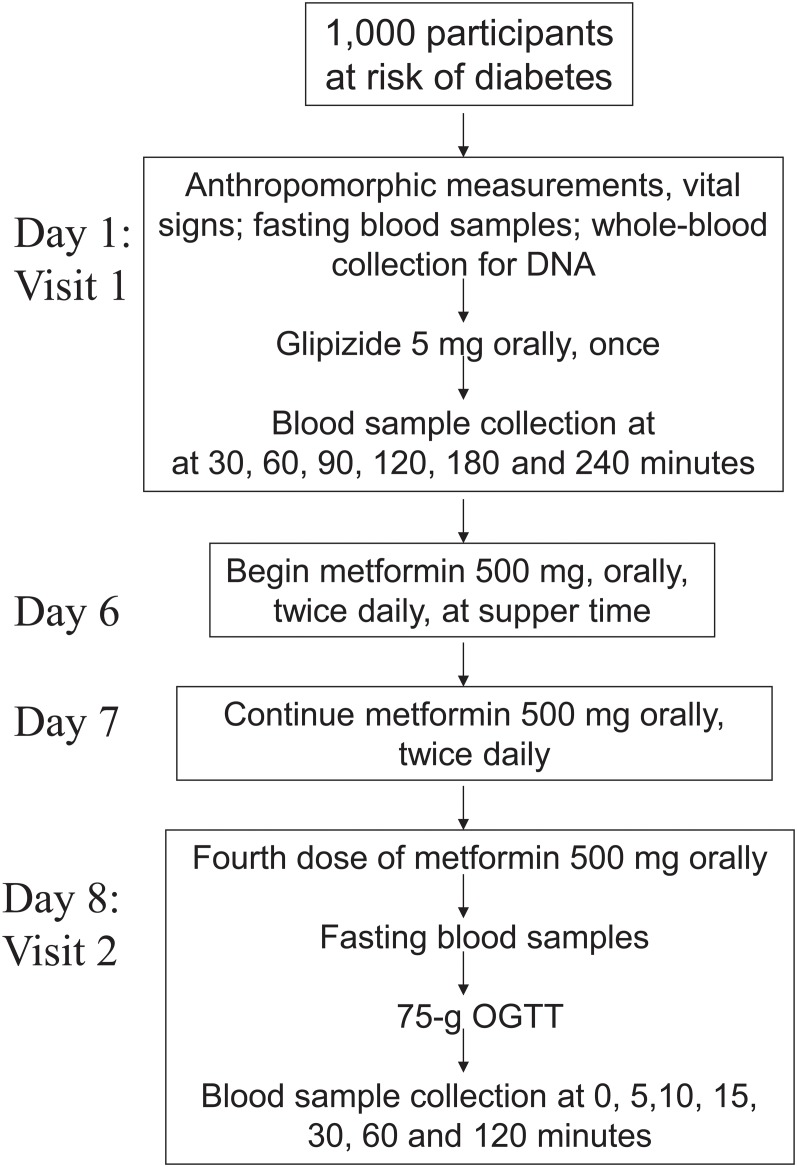
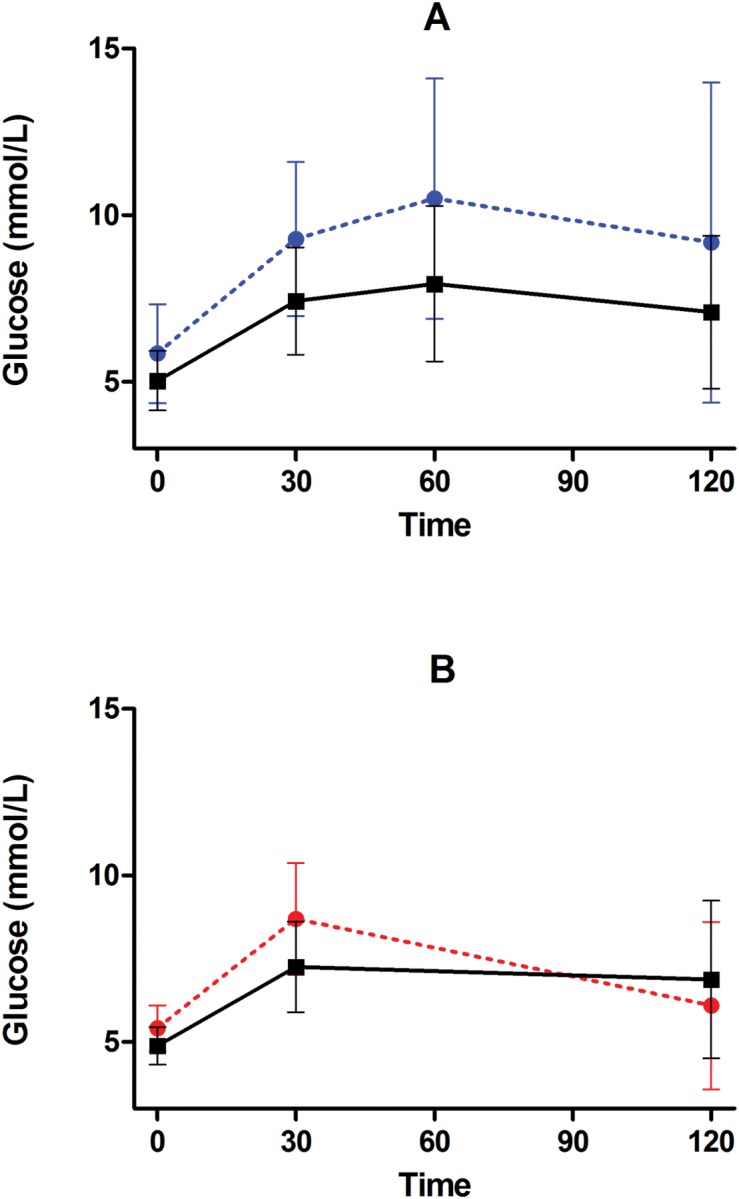
Methods: All individuals are challenged with 5 mg glipizide × 1; twice daily 500 mg metformin × 2 days; and 75-g oral glucose tolerance test following metformin. Genetic variants associated with glycemic traits and blood glucose, insulin, and other hormones at baseline and following each intervention are measured.
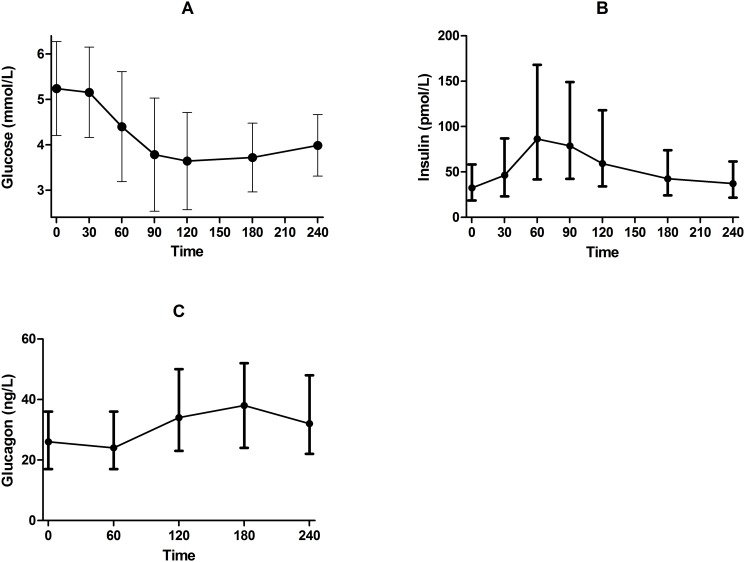
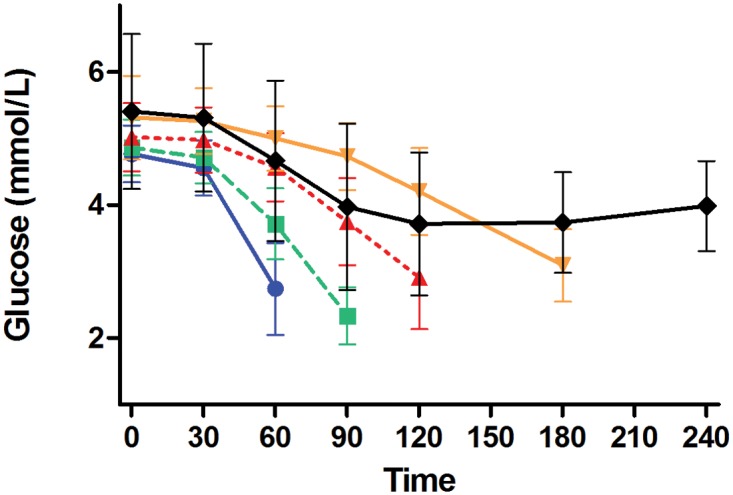
Results: Approximately 50% of the cohort is female and 30% belong to an ethnic minority group. Following glipizide administration, peak insulin occurred at 60 minutes and trough glucose at 120 minutes. Thirty percent of participants experienced non-severe symptomatic hypoglycemia and required rescue with oral glucose. Following metformin administration, fasting glucose and insulin were reduced. Common genetic variants were associated with fasting glucose levels.
Conclusions: SUGAR-MGH represents a viable pharmacogenetic resource which, when completed, will serve to characterize genetic influences on pharmacological perturbations, and help establish the functional relevance of newly discovered genetic loci to therapy of type 2 diabetes.
Trial registration: ClinicalTrials.gov NCT01762046.
Conflict of interest statement
Figures
Similar articles
-
TCF7L2 Genetic Variation Augments Incretin Resistance and Influences Response to a Sulfonylurea and Metformin: The Study to Understand the Genetics of the Acute Response to Metformin and Glipizide in Humans (SUGAR-MGH).Diabetes Care. 2018 Mar;41(3):554-561. doi: 10.2337/dc17-1386. Epub 2018 Jan 11. Diabetes Care. 2018. PMID: 29326107 Free PMC article.
-
The presence of two reduced function variants in CYP2C9 influences the acute response to glipizide.Diabet Med. 2020 Dec;37(12):2124-2130. doi: 10.1111/dme.14176. Epub 2019 Nov 25. Diabet Med. 2020. PMID: 31709648 Free PMC article.
-
Genome-wide association analysis identifies ancestry-specific genetic variation associated with acute response to metformin and glipizide in SUGAR-MGH.Diabetologia. 2023 Jul;66(7):1260-1272. doi: 10.1007/s00125-023-05922-7. Epub 2023 May 26. Diabetologia. 2023. PMID: 37233759 Free PMC article.
-
Repaglinide : a pharmacoeconomic review of its use in type 2 diabetes mellitus.Pharmacoeconomics. 2004;22(6):389-411. doi: 10.2165/00019053-200422060-00005. Pharmacoeconomics. 2004. PMID: 15099124 Review.
-
Genetics of type 2 diabetes mellitus and other specific types of diabetes; its role in treatment modalities.Diabetes Metab Syndr. 2012 Jan-Mar;6(1):54-8. doi: 10.1016/j.dsx.2012.05.014. Epub 2012 Jul 4. Diabetes Metab Syndr. 2012. PMID: 23014256 Review.
Cited by
-
TCF7L2 Genetic Variation Augments Incretin Resistance and Influences Response to a Sulfonylurea and Metformin: The Study to Understand the Genetics of the Acute Response to Metformin and Glipizide in Humans (SUGAR-MGH).Diabetes Care. 2018 Mar;41(3):554-561. doi: 10.2337/dc17-1386. Epub 2018 Jan 11. Diabetes Care. 2018. PMID: 29326107 Free PMC article.
-
The presence of two reduced function variants in CYP2C9 influences the acute response to glipizide.Diabet Med. 2020 Dec;37(12):2124-2130. doi: 10.1111/dme.14176. Epub 2019 Nov 25. Diabet Med. 2020. PMID: 31709648 Free PMC article.
-
Pharmacogenetics in type 2 diabetes: precision medicine or discovery tool?Diabetologia. 2017 May;60(5):800-807. doi: 10.1007/s00125-017-4227-1. Epub 2017 Mar 10. Diabetologia. 2017. PMID: 28283684 Review.
-
A Polygenic Score for Type 2 Diabetes Risk Is Associated With Both the Acute and Sustained Response to Sulfonylureas.Diabetes. 2021 Jan;70(1):293-300. doi: 10.2337/db20-0530. Epub 2020 Oct 26. Diabetes. 2021. PMID: 33106254 Free PMC article.
-
Genome-Wide Meta-analysis Identifies Genetic Variants Associated With Glycemic Response to Sulfonylureas.Diabetes Care. 2021 Dec;44(12):2673-2682. doi: 10.2337/dc21-1152. Epub 2021 Oct 4. Diabetes Care. 2021. PMID: 34607834 Free PMC article.
References
Publication types
MeSH terms
Substances
Associated data
Grants and funding
LinkOut - more resources
Full Text Sources
Other Literature Sources
Medical
