. 2015 Apr;17(4):397-408.
doi: 10.1038/ncb3138.

Myosin-II-mediated cell shape changes and cell intercalation contribute to primitive streak formation

Affiliations

Myosin-II-mediated cell shape changes and cell intercalation contribute to primitive streak formation

Emil Rozbicki et al. Nat Cell Biol. 2015 Apr.

Abstract

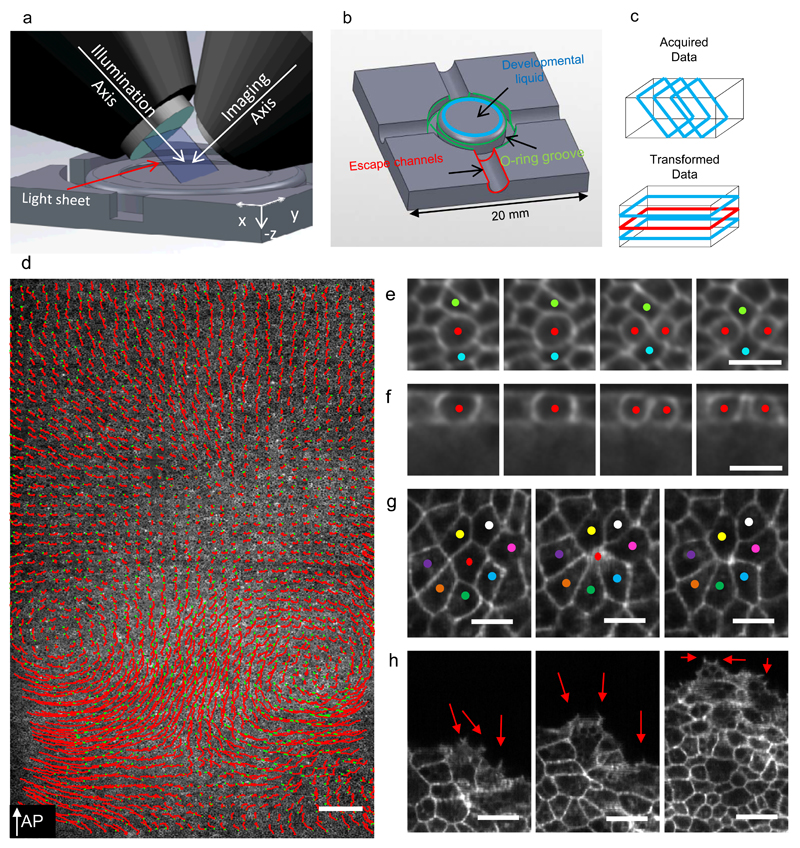
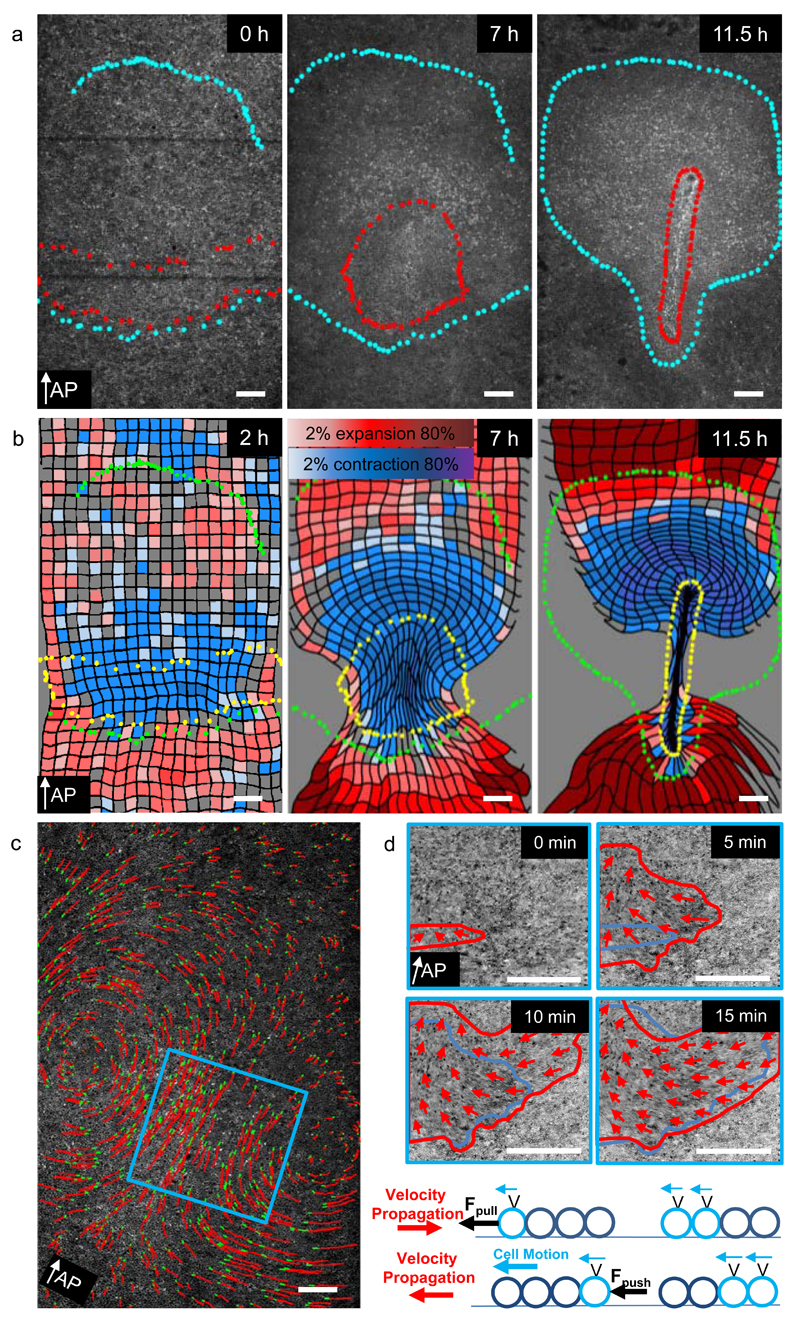
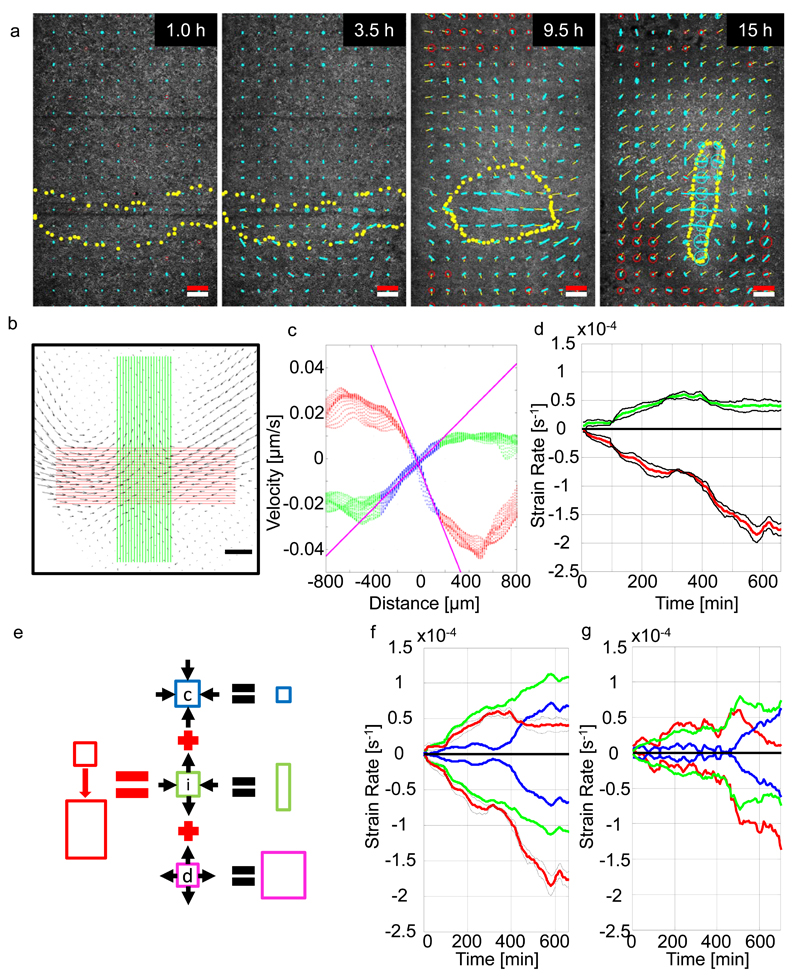
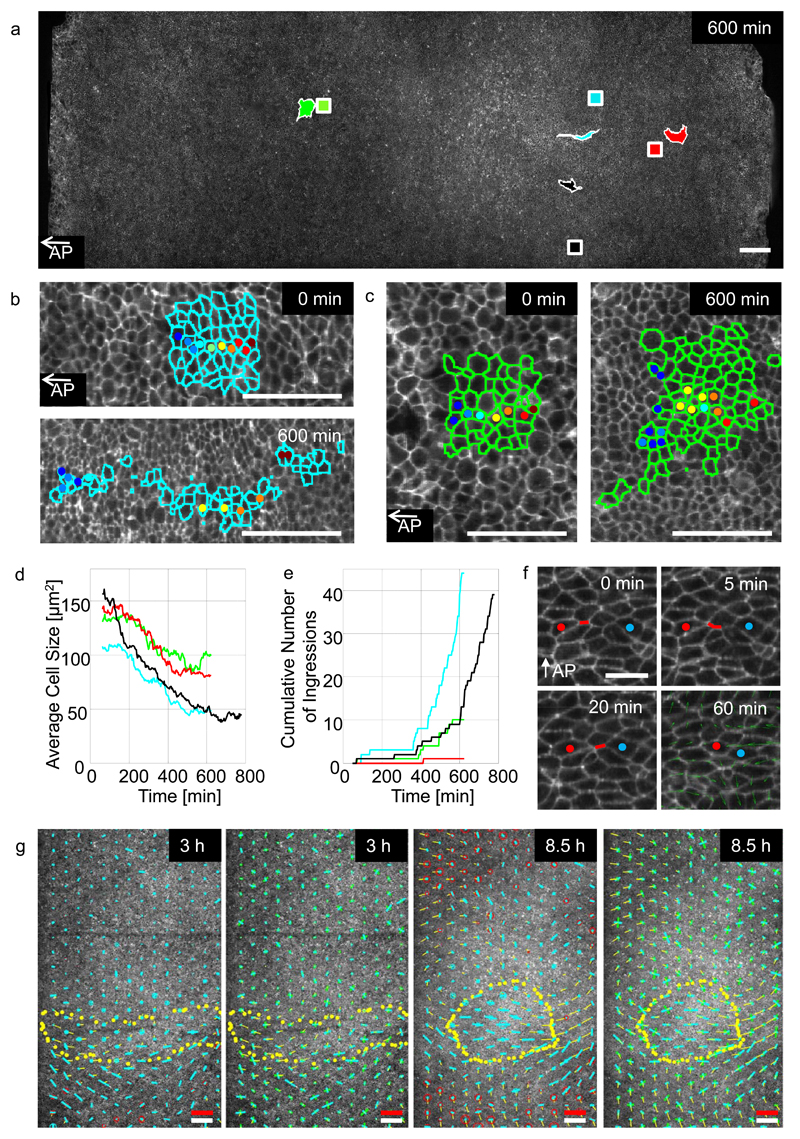
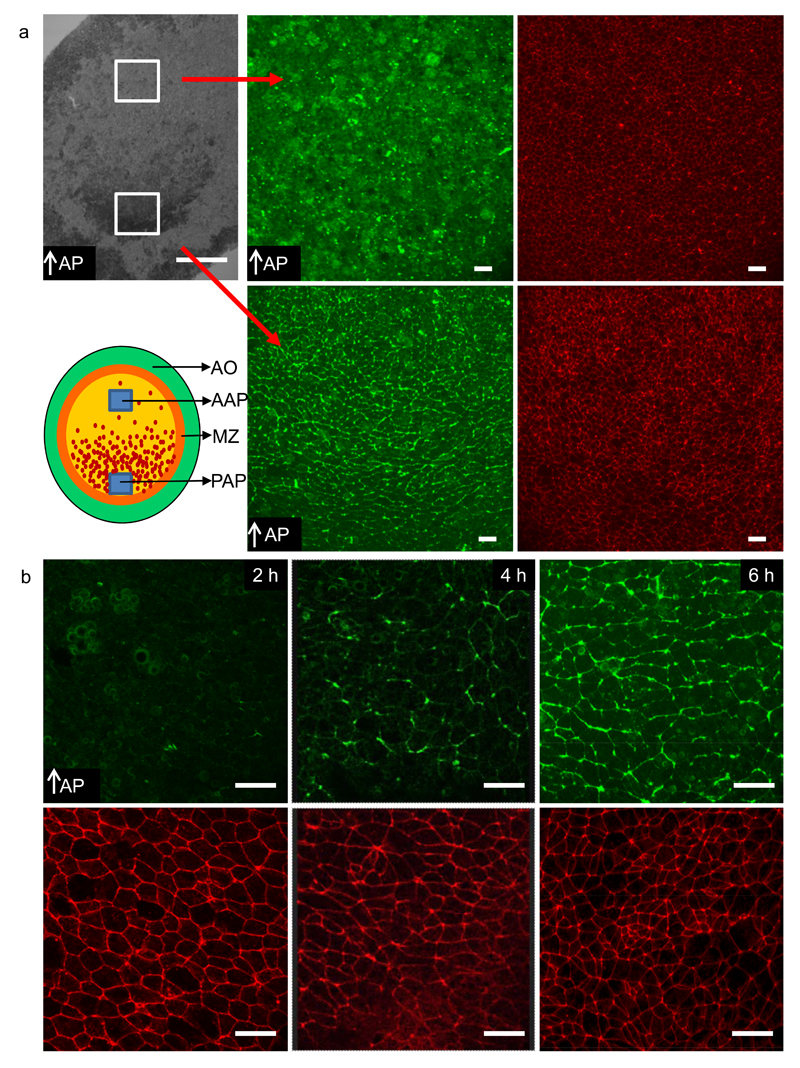
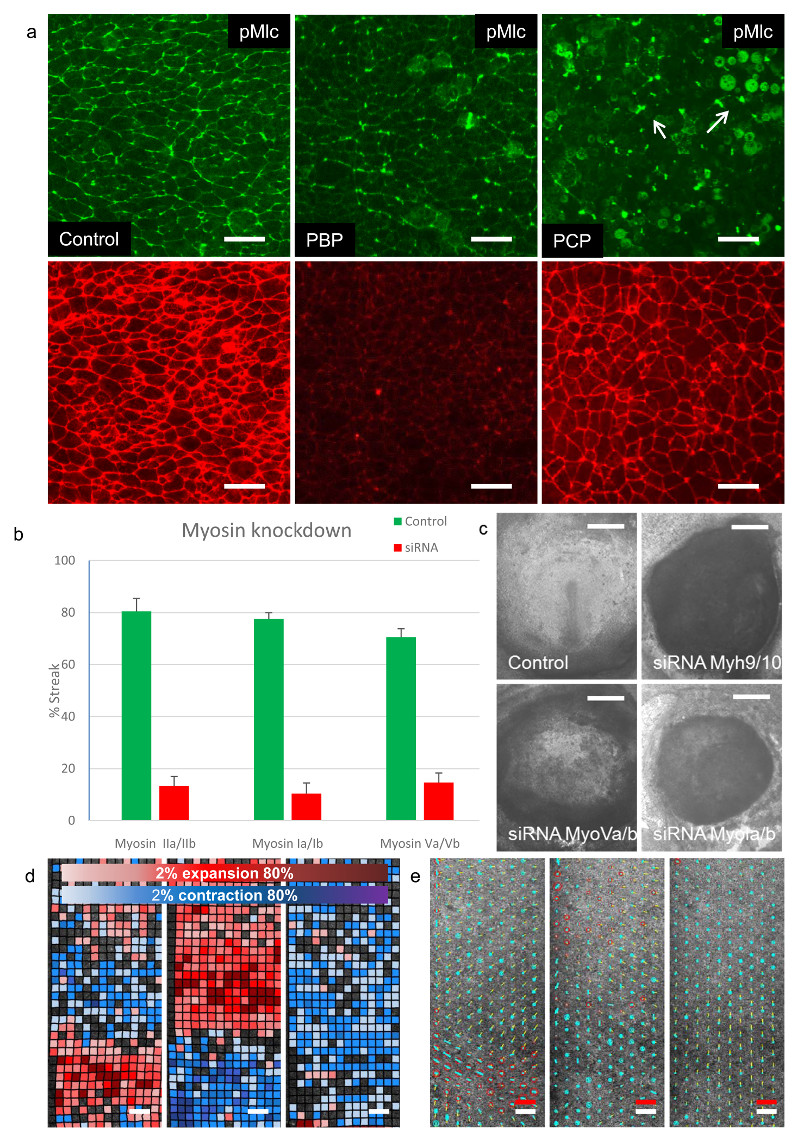
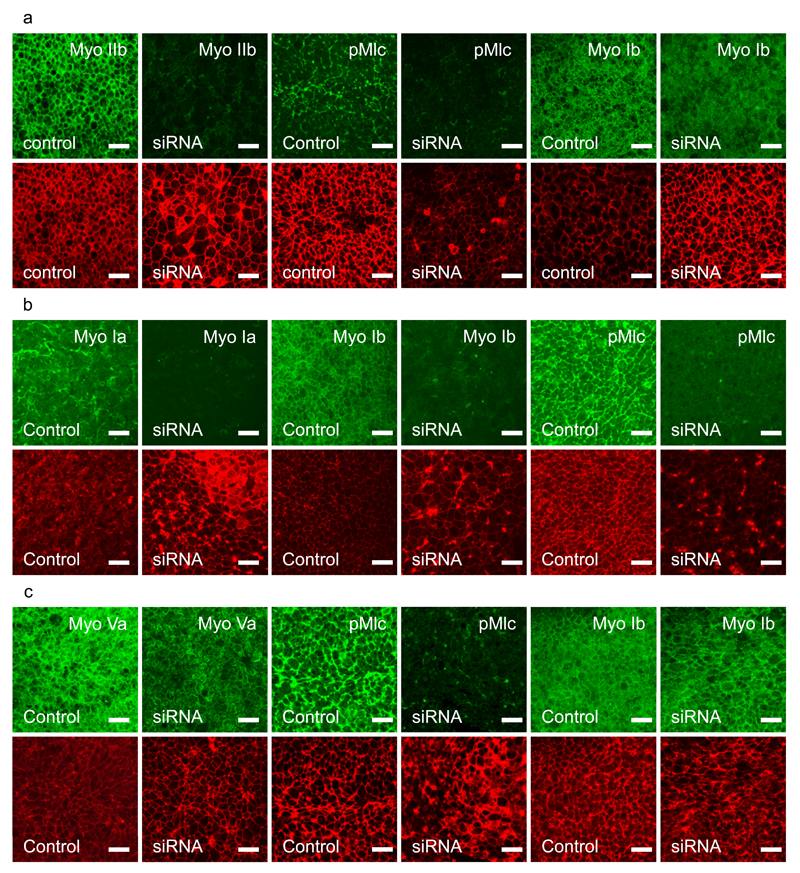
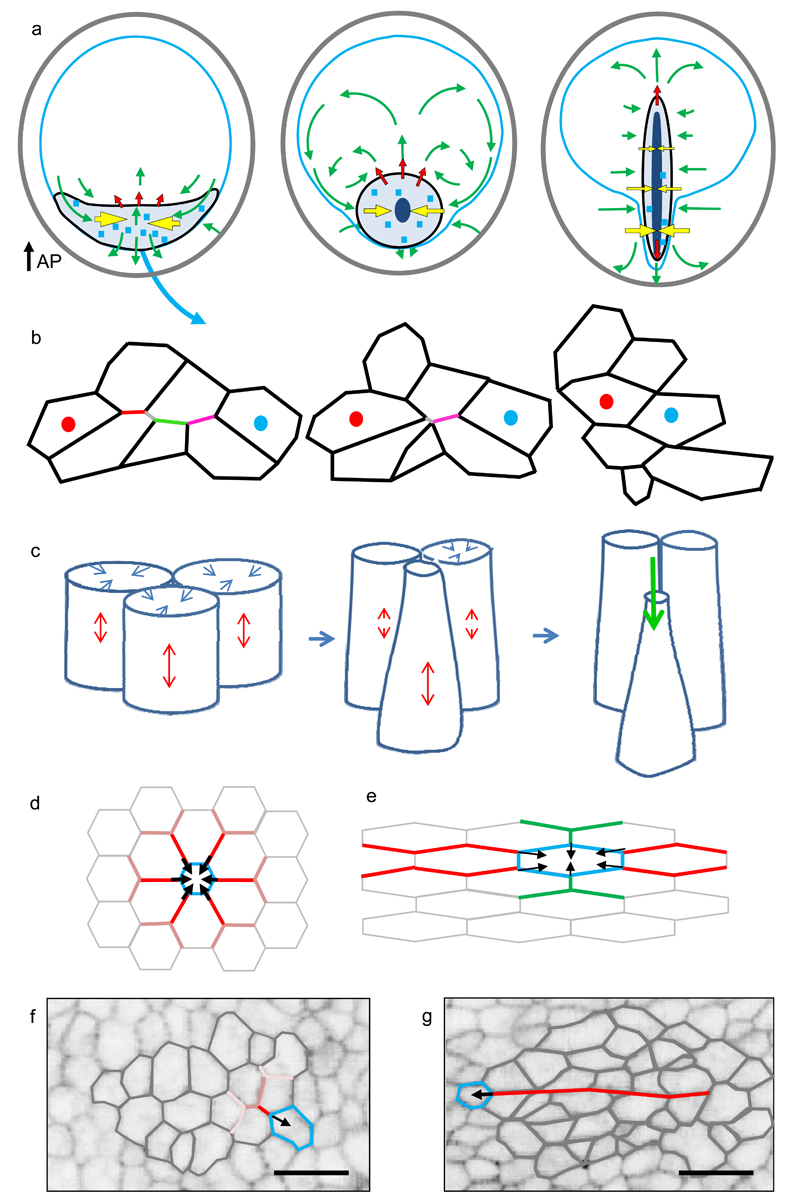
Primitive streak formation in the chick embryo involves large-scale highly coordinated flows of more than 100,000 cells in the epiblast. These large-scale tissue flows and deformations can be correlated with specific anisotropic cell behaviours in the forming mesendoderm through a combination of light-sheet microscopy and computational analysis. Relevant behaviours include apical contraction, elongation along the apical-basal axis followed by ingression, and asynchronous directional cell intercalation of small groups of mesendoderm cells. Cell intercalation is associated with sequential, directional contraction of apical junctions, the onset, localization and direction of which correlate strongly with the appearance of active myosin II cables in aligned apical junctions in neighbouring cells. Use of class specific myosin inhibitors and gene-specific knockdown shows that apical contraction and intercalation are myosin II dependent and also reveal critical roles for myosin I and myosin V family members in the assembly of junctional myosin II cables.


Conflict of interest statement

Competing financial interests

The authors declare no competing financial interests.

Figures

Figure 1
Figure 1. Light-sheet microscopy setup to study gastrulation in chicken embryos.
a-) Schematics of the light-sheet microscope for large flat samples, the illumination and imaging objectives positioned at 45° to the embryo’s surface. Successive 45° cross-sections are collected by moving the embryo through the light-sheet. b-) Sample plate designed to keep the early embryo flat and isolated from external environment. c-) Schematic representations of acquisition geometry (images marked with blue rectangles) and the transformed data for analysis. d-) Single Z plane (red rectangle in C) overlaid with the cell tracks of 5% of all cells over a 180 minute time interval shown as red lines with green dots indicating their final positions (7950×2560 pixels, 5.17mm×1.66mm) (Supplementary Video 1). e-) Four frames 5 minutes apart showing a dividing cell (red dots) and its local neighbourhood shown at full recorded resolution (blue dots) (Supplementary Videos 2,3). f-) Cross-section through the dividing cell seen in E. g-) Three frames 10 minutes apart showing an ingressing cell (red dot, Supplementary Video 4). h-) Three frames 20 minutes apart showing embryo expansion driven by Area Opaca boundary cells making active protrusions (red arrows). The AP arrow in D indicates the direction of the anterior posterior axis, the white scale bar in D is 200 µm. The white scale bars in E, F, G and H are 25 µm in length.
Figure 2
Figure 2. Tissue dynamics using PIV analysis.
a-) Three time points illustrating formation of the primitive streak. Cells contained within red and blue dotted boundary were marked at the streak stage (11.5 h) and tracked backwards to reveal their origin at 0h. White arrow indicates direction of AP axis from posterior to anterior. b-) Three panels illustrating the contraction expansion fate map calculated using the velocity fields as described in Methods. c-) Development of tissue motion pattern over time. Left panel shows the cell flow pattern midway during streak formation. Red lines indicate cell tracks of 5% of randomly selected cells over a 150 minute time interval with green dots indicating their final positions. The blue square indicates the location used to analyse the onset of motion. Each image in the right panel is a maximum intensity projection of 5 consecutive frames (10 min) 5 minutes apart highlighting actively moving cells. Red arrows indicate direction of the tissue flow. Red lines mark the area of moving cells at the current time, while the blue line shows the area moving cells at the previous time point. The area of actively moving cells expands from medial to lateral. The schematic drawing illustrates possible scenarios for cell motion and velocity propagation depending on the type of active force. In case of a pulling force (upper schematic) the onset of motion propagates in a direction opposite to the direction of motion, while in case of a pushing force (lower schematic) onset of cell motion and movement are oriented in the same direction. The white scale bars are 200 µm in length
Figure 3
Figure 3. Analysis of strain rates during streak formation
a-) Evolution of the expansion/compression strain rate of the strain rate tensor and the shear strain rate of the strain rate tensor calculated as described in methods during streak formation. The expansion contraction rates of the strain tensor are shown as circles; blue indicates contraction, red expansion. The anisotropic part indicating the shear strain rate is shown as a line blue line in the direction of contraction. b-) Velocity field at t = 600 min. Green and red lines indicate location of the velocity field vectors used for analysis. Black scale bar is 200 µm. c-) Velocity components as a function of distance along green and red lines in A. Red and green dots indicate velocity components from red and green areas. Blue dots mark fitting range used to determine the strain rate (spatial velocity gradients). Slopes of fitted magenta lines are tissue strain rates. d-) Mean tissue strain rates and standard errors as a function of developmental time of 4 experiments. Red and green line indicate tissue strain rate perpendicular and parallel to the streak respectively. e-) Cellular events driving deformation of epithelial tissue. Contraction/ingression (blue square), cell intercalation (green) and cell growth (magenta). Arrows indicate direction of the tissue flows generated by these processes. Panels E-G show tissue strain rate (red lines) for: f-) wild type embryos, g-) an embryo treated with 50 µM H1152. The tissue strain rates are decomposed into the isotropic part (apical contraction/ingression and cell growth, blue lines) and anisotropic part (intercalation, green lines). The white scale bar in panel a is a 200 µm size marker, the red scale bar in panel a indicates a strain rate of 10-4/sec and a tissue domain velocity of 4 µm/min.
Figure 4
Figure 4. Analysis of cell behaviours controlling gastrulation
a-) Analysis of cell behaviour in four distinct regions marked with different colour squares: the middle (blue) and lateral (black) sickle region, the area opaca (red) and a region in front of the sickle (green). The initial position of the domains are shown as squares, the same coloured irregular shaped domains indicate their positions and shape after 600 minutes. Scale bar 200 µm. b-) Shows outlines of cells manually tracked in the middle sickle domain (blue square) at the start 0 and after 600 minutes respectively. Scale bar 100 µm. c-) Cells tracked in the anterior domain (green) at 0 and 600 minutes respectively. Scale bar 100 µm. d-) Average cell size in the four domains (colours as in A). e-) Ingression of cells in the same four regions. f-) Example of sequential junctional contraction event in sickle region. The successive contractions generate a pulling force perpendicular to the streak axis and a pushing force along AP axis as shown by the velocity field (green arrows, averaged over 60 min). Scale bar 25 µm. g-) Quantitative analysis of the contraction expansion (red/blue circles) rate and shear rate (blue bar in the direction of contraction) of the total tissue strain rate at 3 and 8.5 hours of development (first and third panel). The strain rates are calculated from the changes in the lengths and direction of the vectors linking the centroid positions of all cells with their immediate neighbours as described in methods. The strain rate contribution of the rate of cell shape change (green bars) and the rate of cell rearrangement (blue bars) shown in the direction of contraction (second and fourth panel), are shown in the second and 4th panel. The dotted yellow line indicates the outline of the deforming endoderm. The thin yellow lines indicate the instantaneous velocities of the tissue at the time the strain rate tensors were calculated. The white scale bar in is 200 µm size marker, the red scale bar indicates a strain rate of 10-4/sec and a tissue velocity of 4 µm/min.
Figure. 5
Figure. 5. Spatiotemporal localisation of phosphorylated Myosin light chain cables
a-) Phosphorylated Myosin light chain (pMlc) (green) and actin (red) staining reveals the existence of supercellular active Myosin cables in the posterior are pellucida (sickle region) aligned perpendicular to the axis of streak elongation. pMlc cables are absent in the anterior area pellucida. The red arrows link the areas in the overview image of the embryo with the two high magnification images of pMlc staining in the right hand side panels of a. b-) pMlc staining (green) and actin staining (red) in the posterior area pellucida for embryos at different stages of development (2h, 4h and 6h). Appearance of the pMlc cables coincides with initiation of cell motion. The data shown are representative for results obtained in 3 experiments with 12- 20 embryos in each experiment. Scale bar in first panel is 1 mm, the white scale bars in all other panels are 25 µm.
Figure 6
Figure 6. Effect of inhibition of convention and non-conventional Myosins on streak formation.
a-) Phosphorylated Myosin light chain (green) and actin staining (red) for a control embryo at 8hrs of development (left panel), an embryo developed for 6hrs in EC culture followed by a treatment with 5µM pentabromopseudilin (PCB) for 2 hours showing partial inhibition of Myosin light chain phosphorylation (middle panel), an embryo developed for 6hrs in EC culture followed by a treatment with 5µM pentachloropseudilin (PCP) for 2 hours showing complete inhibition of Myosin light chain phosphorylation (right panel). White arrows indicate pMLC localisation in contraction furrow of dividing cells in the PCP treated embryo. The results shown are representative for 3-5 experiments with n> 20 embryos in control and treatment. All embryos were visually inspected by fluorescence microscopy and at least 1 control and 1 inhibitor treated embryo was analysed in detail by confocal microscopy. b-) Effects of knockdown of different classes of Myosins on streak formation. Results shown are means and standard deviations of Myosin IIa/IIb (control n=95 embryos/7 independent experiments, siRNA n=59 embryos/7 independent experiments,), Myosin Ia/Ia (control n=111 embryos/10 independent experiments, siRNA knockdown n=90 embryos/10 independent experiments) and Myosin Va/Vb (control n=31 embryos/3 independent experiments, siRNA n=41 embryos/3 independent experiments) on streak formation 18rs after transfection with the respective siRNA’s. c-) Images of typical embryos 18hrs after transfection with control or specific siRNA’s. The controls mostly develop streaks, the Myosin knockdowns typically do not as indicated in b. Knockdown of Myosin IIa/IIb and Myosin Ia/Ib results in very contracted embryos, knockdown of Myosin Va/Vb results in embryos that expand but the majority do not develop streaks. Scale bar 1 mm. d-) Contraction/expansion map of an embryo before and after treatment with 5µM pcp. First panel 5 hrs of development before treatment. Middle panel 30 minutes after pcp addition, right panel 5hrs after PCP addition. Note the immediate relaxation of the epiblast after PCP addition followed by a later contraction of the embryo. e-) Analysis of the isotropic and anisotropic shear strain rate of the embryo shown in d. Analysis was performed as described for the embryo shown in Fig. 3A. Note the expansion of the tissue and the loss of shear strain after pcp addition, followed by contraction 5hrs after addition of PCP. The white scale bar represent 200µm, the red scale bar indicates a strain rate of 10-4/s and an instantaneous tissue speed of 4 µm/min.
Figure 7
Figure 7. Effects of siRNA mediated Myosin I, II and V downregulation
a-) Effect of simultaneous Myosin IIa and Myosin IIb knockdown. Upper panels show from left to right, expression of Myosin IIb in control embryos, after Myosin IIa/IIb knockdown. pMlc phosphorylation in control and after Myosin IIa/IIb knockdown. Myosin Ib expression in control and after Myosin IIa/IIb knockdown. The lower panels show phalloidin staining for the same samples directly above. There is strong knockdown of Myosin IIb and pMlc, but little effect on Myosin Ib staining. Embryos were incubated for 3hrs, put in EC culture and transfected with specific or control siRNA’s. All samples were fixed 18 hrs after transfection. The controls had reached the primitive streak stages (HH3-4), while the transfected embryos did not develop into streaks, Scalebar, 25µm. b-) Effect of simultaneous Myosin Ia and Myosin Ib knockdown. Upper panels show from left to right; expression of Myosin Ia in control and after Myosin Ia/Ib double knockdown, Myosin Ib expression in control and after Myosin Ia/Ib double knockdown. pMlc expression in a control and after Myosin Ia/Ib knockdown. The red panels show Phalloidin staining for the same samples positioned directly above. There is strong knockdown of Myosin Ia, Myosin Ib and pMlc, note the effect on the changes in actin distribution. Other conditions as in A. c-) Effects of simultaneous Myosin Va and Myosin Vb knockdown. Upper row from left to right, Myosin Va expression in control and after Myosin Va/Vb knockdown; pMLC expression in a control embryo and after Myosin Va/Vb knockdown; Myosin Ib expression in control and after Myosin Va/Vb double knockdown. The lower panels show Phalloidin staining for the same samples directly above. There is a noticeable loss of Myosin Va membrane staining in the knockdown samples and a great loss of pMlc expression, but little effect on Myosin Ib expression. Other conditions as in A. The data shown in this figure are representative for outcomes of the siRNA knockdown experiments shown in Fig 6b. All samples (control and siRNA of each experiment were stained with the relevant antibodies and inspected by fluorescence microscopy, at least 1 control embryo and 1 siRNA treated embryo of each experiment was investigated in detail by confocal microscopy).
Figure 8
Figure 8. Model of the forces and cell behaviours controlling streak formation.
a-) Diagrams depicting forces generating the tissue flows during streak formation. The active pulling forces - yellow arrows, the passive pushing forces - red arrows, the direction of tissue flows - green arrows. The sickle region is indicated in black, the Area Pellucida outline in blue. Light blue squares indicate scattered events of junctional contraction, while dark blue shapes indicate regions of ingression. b-) Schematic of sequential junctional contraction (in a region marked by the blue squares in A). The sequentially contracting junctions are indicated with different (red grey, green, magenta) colours. c-) Schematic of cells showing apical contraction (blue arrows, coupled to elongation (red arrows) along the apical axis followed by ingression (green arrow). d-) Propagation of the force generated by contracting/ingressing cell between symmetrically and e-) asymmetrically shaped cells. In case of symmetrical cells the magnitude of the force decreases strongly and symmetrically at every successive junction bifurcation. However, for asymmetric cells, the broken symmetry favours force transmission along the aligned junctions (red lines), while damping transmission in perpendicular directions (green lines). f-) Image of randomly oriented cells outside the sickle region, showing lack of junctional alignment. g-) Image of cells inside the sickle, showing many aligned junctions in neighbouring cells forming long chains (red line). The alignment of asymmetrically shaped cells inside the sickle region (Fig. S5) enables anisotropic force propagation by apical contraction and directional junctional shortening resulting in large scale directed motion. Scale bar in F and G, 25 µm.

References

    1. Stern CD. Gastrulation, from cells to embryo′s. Cold Spring Harbor Laboratory Press; New York: 2004.
    1. Weinberger C, Brick I. Primary hypoblast development in the chick II. The role of cell division. Wilhelm Roux' Arch. Entwicklungsmechan.Org. 1982;191:127–133. - PubMed
    1. Stern CD, Downs KM. The hypoblast (visceral endoderm): an evo-devo perspective. Development. 2012;139:1059–1069. - PMC - PubMed
    1. Nakaya Y, Sheng G. Epithelial to mesenchymal transition during gastrulation: an embryological view. Dev Growth Differ. 2008;50:755–766. - PubMed
    1. Nakaya Y, Sukowati EW, Wu Y, Sheng G. RhoA and microtubule dynamics control cell-basement membrane interaction in EMT during gastrulation. Nat Cell Biol. 2008;10:765–775. - PubMed

Publication types

MeSH terms

LinkOut - more resources