. 2015 Apr;17(4):409-20.
doi: 10.1038/ncb3135.

Control of cell-cell forces and collective cell dynamics by the intercellular adhesome

Affiliations

Control of cell-cell forces and collective cell dynamics by the intercellular adhesome

Elsa Bazellières et al. Nat Cell Biol. 2015 Apr.

Abstract

Dynamics of epithelial tissues determine key processes in development, tissue healing and cancer invasion. These processes are critically influenced by cell-cell adhesion forces. However, the identity of the proteins that resist and transmit forces at cell-cell junctions remains unclear, and how these proteins control tissue dynamics is largely unknown. Here we provide a systematic study of the interplay between cell-cell adhesion proteins, intercellular forces and epithelial tissue dynamics. We show that collective cellular responses to selective perturbations of the intercellular adhesome conform to three mechanical phenotypes. These phenotypes are controlled by different molecular modules and characterized by distinct relationships between cellular kinematics and intercellular forces. We show that these forces and their rates can be predicted by the concentrations of cadherins and catenins. Unexpectedly, we identified different mechanical roles for P-cadherin and E-cadherin; whereas P-cadherin predicts levels of intercellular force, E-cadherin predicts the rate at which intercellular force builds up.


Figures
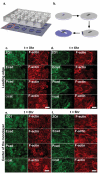
Figure 1
Figure 1. Intercellular cohesiveness increases with monolayer expansion
Scheme of the experimental setup. (a) A large glass slide was attached to a custom-made PDMS frame containing 15 openings that served as individual wells. Each well contained a collagen I-coated micropatterned gel. (b) A PDMS membrane with a rectangular opening was deposited on top of each polyacrylamide gel. Next, cells were seeded on top of each gel and allowed to adhere. After 5 hours, the PDMS membranes were removed. (c-f) Localization of ZO-1, E-cadherin, P-cadherin, α-catenin, and F-actin at the leading edge (c,d) and center (e,f) of the monolayer at t=0hr (c,e) and t=6hr (d,f). Scale bar 20μm.
Figure 2
Figure 2. As the monolayer increases its cohesiveness, cell migration slows down and physical forces buildup
Phase contrast images (a,b), maps of cell velocities (c,d), maps of traction forces (e,f), and maps of monolayer tension (g,h) at t=0hr (a,c,e,g) and t=6hr (b,d,f,h). Time evolution of monolayer area (i), cell velocity (j), strain energy density (k), and monolayer tension (l). Scale bar, 100μm. Data are presented as mean ± SEM (n = 13 independent cell monolayers assessed over 10 experiments).
Figure 3
Figure 3. Downregulation of adherens junctions alters monolayer dynamics
Representative maps showing the effect of siRNAs on monolayer dynamics after 8hr of expansion. For each siRNA, each row displays phase contrast images (first row), monolayer velocity (second row), traction force (third row), and intercellular tension (forth row). Panels show the control case (a) and selected siRNAs targeting adherens junctions (b-f). Additional time points and siRNA perturbations are shown in Supplementary Figs. 2-4. Time evolution of monolayer area (shown as the increase from the initial area) (g), cell velocity (h), strain energy density (i), and intercellular tension (j) for the control case and siRNAs shown in panels b-f. The time evolution of physical properties in response to all siRNAs is shown in Supplementary Fig. 8. Scale bar, 100μm. Data are presented as mean ± SEM. n=13 independent cell monolayers (siCT), n=4 independent cell monolayers (siαcat, siPcad, sip120), n=3 independent cell monolayers (siEcad, siβcat); monolayers were assessed over 10 experiments (siCT), 3 experiments (siαcat), 2 experiments (siPcad, sip120, siEcad, siβcat).
Figure 4
Figure 4. Downregulation of tight junctions, desmosomes, and gap junctions alters monolayer dynamics
Representative maps showing the effect of siRNAs on monolayer dynamics after 8hr of expansion. For each siRNA, each row displays phase contrast images (first row), monolayer velocity (second row), traction force (third row), and intercellular tension (forth row). Panels show the control case (a) and selected siRNAs targeting tight junctions (b-d), desmosomes (e), and gap junctions (f). Additional time points and siRNA perturbations are shown in Supplementary Figs. 5-7. Time evolution of monolayer area (shown as the increase from the initial area) (g), cell velocity (h), strain energy density (i), and intercellular tension (j) for the control case and the 5 siRNAs shown in panels b-f. The time evolution of physical properties in response to all siRNAs is shown in Supplementary Fig. 8. Scale bar, 100μm. Data are presented as mean ± SEM. n=13 independent cell monolayers (siCT), n=3 independent cell monolayers (siJamA, siZO3), n=4 independent cell monolayers (siCx43), n=5 independent cell monolayers (siDSC3), n=7 independent cell monolayers (siZO1); monolayers were assessed over 10 experiments (siCT), 3 experiments (siCx43, siDSC3), 2 experiments (siJamA, siZO3, siZO1).
Figure 5
Figure 5. Cell monolayers with perturbed cell-cell adhesions exhibit distinct mechanical phenotypes
(a) Effect of siRNAs on physical properties expressed in terms of their z-scores (see Supplementary Table 1 and Supplementary Note for a description of each physical property). (b) Correlation between physical properties computed as the cosine similarity between all possible pairs of columns in panel (a). (c) Correlation between siRNAs computed as the cosine similarity between all possible pairs of rows in panel (a). An unsupervised clustering algorithm was used to order rows and columns in panels (b) and (c) and to identify clusters whose separation is marked with black lines. (d) Reorganization of panel (a) into phenotypic clusters according to the unsupervised analysis of correlation matrices (b) and (c). FS (Fast/Strong), FW (Fast/Weak), SW (Steady/Weak).
Figure 6
Figure 6. Protein concentrations predict intercellular forces and their buildup rate
(a) z-scores of protein concentrations in response to siRNA perturbations. (b) Correlation between protein expression patterns computed as the cosine similarity between columns in panel (a). (c) The concentration of P-cadherin predicts average intercellular tension. (d) The concentration of P-cadherin predicts intercellular tension at the end of the experiment. (e) The concentration of E-cadherin predicts the rate of intercellular tension buildup. The x-axis in panels c-e shows the values predicted by the 1-protein models whereas the y-axis shows the experimental values. Each data point corresponds to one siRNA perturbation. Error bars in panels are SEM. n=13 independent cell monolayers (siCT), n=7 independent cell monolayers (siZO1), n=4 independent cell monolayers (siPcad, sip120, siVcl, siJup, siαcat), n=3 independent cell monolayers (siEcad, siNcad, siβcat, siLima, siDRR1, siZO3, siPkp2); monolayers were assessed over 10 experiments (siCT), 3 experiments (siαcat), 2 experiments (siEcad, siNcad, siβcat, siLima, siDRR1, siZO3, siPkp2, siPcad, sip120, siVcl, siJup, siZO1). All predictions displayed in panels c-e were significant to p<0.05 using a leave-one-out cross-validation. See Supplementary Table 2 for values of prediction errors. See Supplementary Table 3 for predictions by N-protein models.
Figure 7
Figure 7. Force applied to E-cadherin triggers reinforcement feedback loops whereas force applied to P-cadherin does not
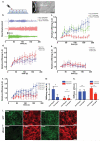
(a) Experimental setup: magnetic beads coated with E-cadherin or P-cadherin were attached to the apical surface of MCF10A monolayers and subjected to a series force pulses using magnetic tweezers. (b) Representative examples of bead displacements for P-cadherin-coated beads bound to control cells (red), E-cadherin-coated beads bound to control cells (blue), and P-cadherin-coated beads bound to siEcad cells (green). (c) Relative stiffening of the cell-bead contact for P-cadherin-coated beads bound to control cells (red, n=22 beads pooled from 9 independent wells), E-cadherin-coated beads bound to control cells (blue, n=26 beads pooled from 9 independent wells), and P-cadherin-coated beads bound to cells depleted of E-cadherin (green, n=23 beads pooled from 9 independent wells). (d) Relative stiffening of the junction between cells and beads coated with E-cadherin in response to oscillatory forces of amplitude 0.25 nN (purple, n=22 beads pooled from 9 independent wells), 0.5 nN (blue, n=20 beads pooled from 9 independent wells) and 1 nN (red, n=13 beads pooled from 9 independent wells). (e) Relative stiffening of the junction between cells and beads coated with P-cadherin in response to oscillatory forces of amplitude 0.25 nN (purple, n=16 beads pooled from 9 independent wells), 0.5 nN (blue, n=16 beads pooled from 9 independent wells) and 1 nN (red, n=15 beads pooled from 9 independent wells). (f) Relative stiffening of the junction between cells and beads coated with E-cadherin (blue) and P-cadherin (red) using coating solutions of 2 μg/ml (open symbols) or 20 μg/ml (filled symbols). (g) Stiffening rate (slope of curves in panel f) of the cell-bead contact. (h) Initial stiffness of the cell bead contact. In c-h data are represented as mean+SEM. * indicates p<0.05, *** indicates p<0.001 (Mann-Whitney Rank Sum t-test). n.s. indicates non-significant comparisons. In (f-h) n=17 beads pooled from 6 independent wells for Ecad 20μg/ml; n=16 beads pooled from 6 independent wells for Ecad 2μg/ml; n=16 beads pooled from 6 independent wells for Pcad 20μg/ml; n=17 beads pooled from 6 independent wells for Pcad 2μg/ml. (i) Staining of E-cadherin, P-cadherin, and F-actin (phalloidin) under control conditions and (j) after E-cadherin knock down. Scale bar, 20 μm (a, i-j).
Figure 8
Figure 8. Vinculin is involved in mechanotransduction through P-cadherin and E-cadherin
(a) Phase contrast image (left) and staining (right) of vinculin (Vcl) after force application at the contact between control cells and beads coated with E-cadherin. (b) Phase contrast image (left) and staining (right) of vinculin after force application at the contact between control cells and beads coated with P-cadherin. (c) Phase contrast image (left) and staining (right) of vinculin (Vcl) after force application at the contact between cells depleted of E-cadherin and beads coated with P-cadherin. (d) Vinculin recruitment at the cell-bead contact for E-cadherin-coated beads bound to control cells (blue, n=25 beads pooled from 12 independent wells), P-cadherin coated beads bound to control cells (red, n=28 beads pooled from 12 independent wells) and P-cadherin coated beads bound to cells depleted of E-cadherin (green, n=20 beads pooled from 9 independent wells). Data are presented as mean ± SEM (normalized to Vcl recruitment in E-cadherin-coated beads bound to control cells) (e) Relative stiffening at the end of bead pulling assays (180 s). Beads were coated with P-cadherin (blue) or E-cadherin (red). In e, n=26 beads pooled from 9 independent wells for siCT/Ecad beads; n=22 beads pooled from 9 independent wells for siVcl/Ecad beads; n=22 beads pooled from 9 independent wells for siCT/Pcad beads; n=23 beads pooled from 9 independent wells for siEcad/Pcad beads; n=36 beads pooled from 9 independent wells for siEcad/siVcl/Pcad beads. Data are represented as mean+SEM. * indicates p<0.05, *** indicates p<0.001 when compared with siCT. n.s. indicates non-significant comparisons (Mann-Whitney Rank Sum t-test). Scale bar, 10 μm (a,b,c).

References

    1. Friedl P, Gilmour D. Collective cell migration in morphogenesis, regeneration and cancer. Nature reviews. Molecular cell biology. 2009;10:445–457. - PubMed
    1. Weber GF, Bjerke MA, DeSimone DW. A mechanoresponsive cadherin-keratin complex directs polarized protrusive behavior and collective cell migration. Developmental cell. 2012;22:104–115. - PMC - PubMed
    1. Heisenberg CP, Bellaiche Y. Forces in tissue morphogenesis and patterning. Cell. 2013;153:948–962. - PubMed
    1. Leckband DE, le Duc Q, Wang N, de Rooij J. Mechanotransduction at cadherin-mediated adhesions. Current opinion in cell biology. 2011;23:523–530. - PubMed
    1. Budnar S, Yap AS. A mechanobiological perspective on cadherins and the actin-myosin cytoskeleton. F1000Prime Rep. 2013;5:35. - PMC - PubMed

Publication types