. 2015 May 19;131(20):1755-62.
doi: 10.1161/CIRCULATIONAHA.114.015080. Epub 2015 Mar 26.

Poorly cited articles in peer-reviewed cardiovascular journals from 1997 to 2007: analysis of 5-year citation rates

Affiliations

Poorly cited articles in peer-reviewed cardiovascular journals from 1997 to 2007: analysis of 5-year citation rates

Isuru Ranasinghe et al. Circulation. .

Abstract

Background: The extent to which articles are cited is a surrogate of the impact and importance of the research conducted; poorly cited articles may identify research of limited use and potential wasted investments. We assessed trends in the rates of poorly cited articles and journals in the cardiovascular literature from 1997 to 2007.

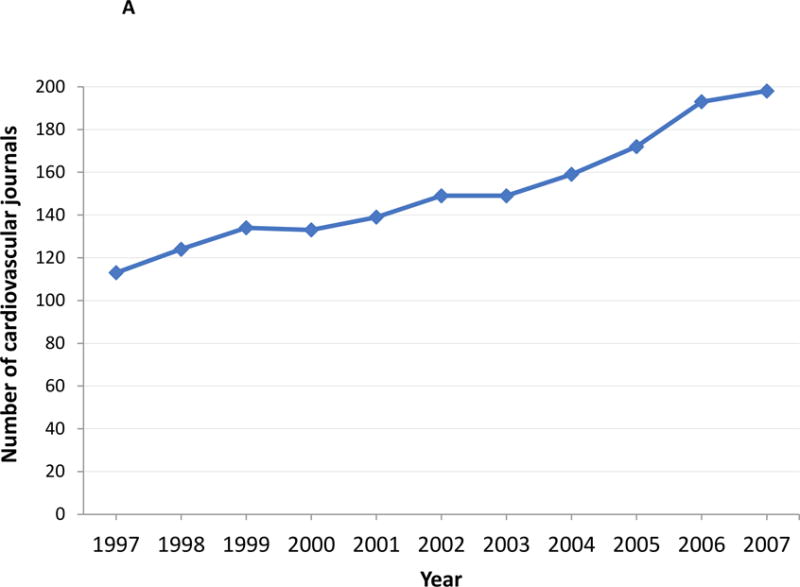
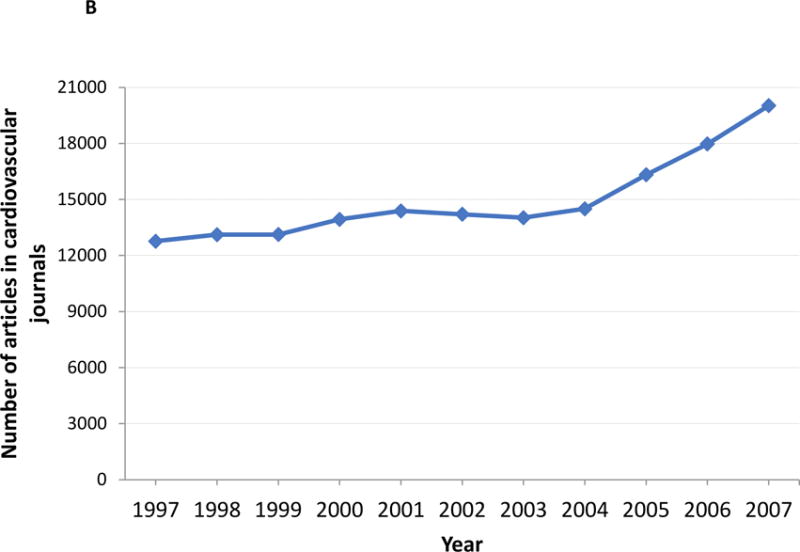
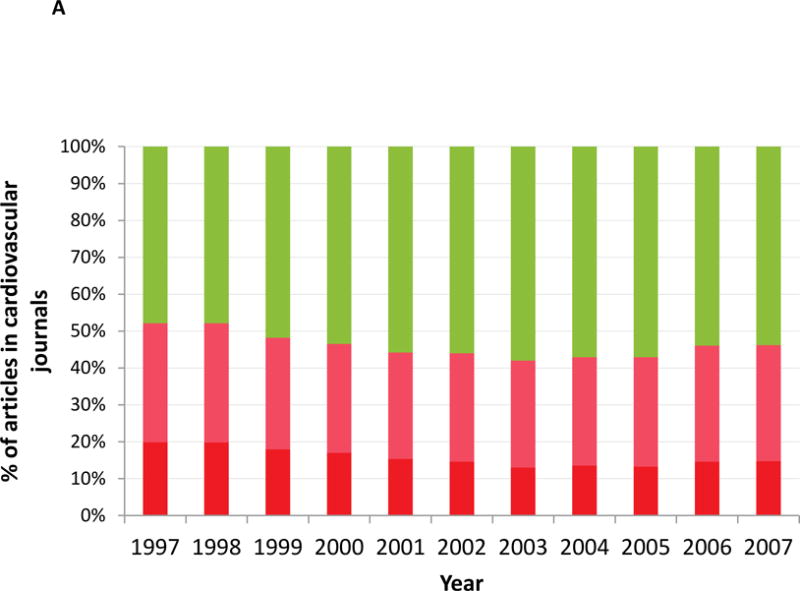
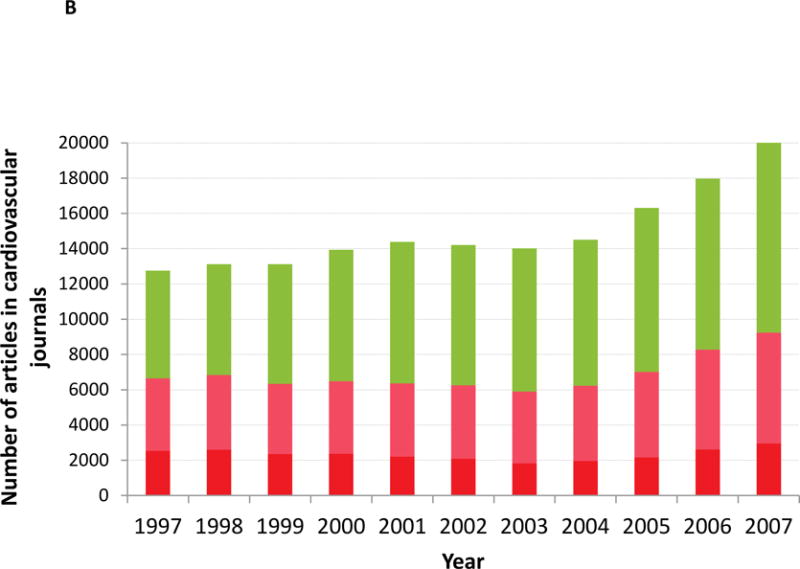
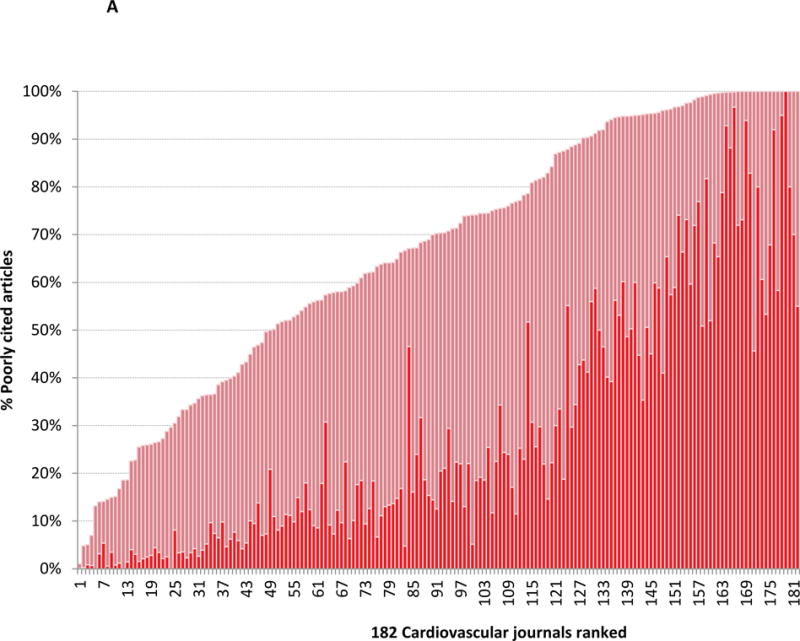
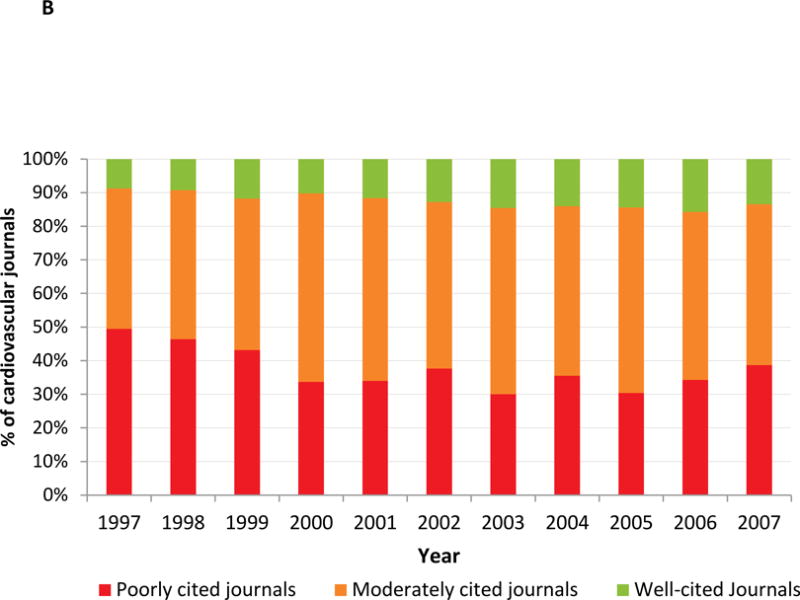
Methods and results: We identified original articles published in cardiovascular journals and indexed in the Scopus citation database from 1997 to 2007. We defined poorly cited articles as those with ≤5 citations in the 5 years following publication and poorly cited journals as those with >75% of journal content poorly cited. We identified 164 377 articles in 222 cardiovascular journals from 1997 to 2007. From 1997 to 2007, the number of cardiovascular articles and journals increased by 56.9% and 75.2%, respectively. Of all the articles, 75 550 (46.0%) were poorly cited, of which 25 650 (15.6% overall) had no citations. From 1997 to 2007, the proportion of poorly cited articles declined slightly (52.1%-46.2%, trend P<0.001), although the absolute number of poorly cited articles increased by 2595 (trend P<0.001). At a journal level, 44% of cardiovascular journals had more than three-fourths of the journal's content poorly cited at 5 years.

Conclusion: Nearly half of all peer-reviewed articles published in cardiovascular journals are poorly cited 5 years after publication, and many are not cited at all. The cardiovascular literature and the number of poorly cited articles both increased substantially from 1997 to 2007. The high proportion of poorly cited articles and journals suggests inefficiencies in the cardiovascular research enterprise.

Keywords: analysis; bibliometrics; citation; journal impact factor.


Figures

Figure 1
Figure 1
Figure 1 shows the yearly trend in the number of cardiovascular journals (1A) and articles in cardiovascular journals (1B).
Figure 1
Figure 1
Figure 1 shows the yearly trend in the number of cardiovascular journals (1A) and articles in cardiovascular journals (1B).
Figure 2
Figure 2
Figure 2 shows the yearly trend in the proportion (2A) and absolute number (2B) of poorly cited and well cited articles from 1997–2007. The red bars indicate poorly cited articles with the darker red bars indicating the subset of uncited articles among the poorly cited articles. The green bars indicate well cited articles.
Figure 2
Figure 2
Figure 2 shows the yearly trend in the proportion (2A) and absolute number (2B) of poorly cited and well cited articles from 1997–2007. The red bars indicate poorly cited articles with the darker red bars indicating the subset of uncited articles among the poorly cited articles. The green bars indicate well cited articles.
Figure 3
Figure 3
Figure 3A shows cardiovascular journals ranked by the proportion of poorly cited article content. Journals with the least amount of poorly cited content are placed on the left of the graph (journal 1) and those with the highest proportion of poorly cited content is placed to the right of the graph (journal 182). The red bars indicate the proportion of poorly cited content. The dark red bars indicate the proportion of uncited content; a subset of the poorly cited content. Only journals with at least 20 publications in a given year were included in this analysis. Figure 3B shows the yearly trend in poorly cited journals from 1997 to 2007. The red bars indicate the proportion of poorly cited journals. Orange bars indicate the proportion of moderately cited journals and the green bars indicate the proportion of well cited journals. Only journals with at least 20 publications in a given year were included in this analysis.
Figure 3
Figure 3
Figure 3A shows cardiovascular journals ranked by the proportion of poorly cited article content. Journals with the least amount of poorly cited content are placed on the left of the graph (journal 1) and those with the highest proportion of poorly cited content is placed to the right of the graph (journal 182). The red bars indicate the proportion of poorly cited content. The dark red bars indicate the proportion of uncited content; a subset of the poorly cited content. Only journals with at least 20 publications in a given year were included in this analysis. Figure 3B shows the yearly trend in poorly cited journals from 1997 to 2007. The red bars indicate the proportion of poorly cited journals. Orange bars indicate the proportion of moderately cited journals and the green bars indicate the proportion of well cited journals. Only journals with at least 20 publications in a given year were included in this analysis.
Figure 4
Figure 4
Figure 4A shows the trend in uncited and poorly cited articles stratified by the open access status of the journal. Figure 4B shows open-access cardiovascular journals ranked by the proportion of poorly cited article content. The red bars indicate the proportion of poorly cited content. The dark red bars indicate the proportion of uncited content; a subset of the poorly cited content.
Figure 4
Figure 4
Figure 4A shows the trend in uncited and poorly cited articles stratified by the open access status of the journal. Figure 4B shows open-access cardiovascular journals ranked by the proportion of poorly cited article content. The red bars indicate the proportion of poorly cited content. The dark red bars indicate the proportion of uncited content; a subset of the poorly cited content.

Comment in

References

    1. Zhang Y, Kou J, Zhang XG, Zhang L, Liu SW, Cao XY, Wang YD, Wei RB, Cai GY, Chen XM. The evolution of academic performance in nine subspecialties of internal medicine: an analysis of journal citation reports from 1998 to 2010. PLoS One. 2012;7:e48290. - PMC - PubMed
    1. Cooper NJ, Jones DR, Sutton AJ. The use of systematic reviews when designing studies. Clin Trials. 2005;2:260–264. - PubMed
    1. Ross JS, Mulvey GK, Hines EM, Nissen SE, Krumholz HM. Trial Publication after Registration in ClinicalTrials.Gov: A Cross-Sectional Analysis. Plos Med. 2009;6 - PMC - PubMed
    1. Hewitt C, Hahn S, Torgerson DJ, Watson J, Bland MJ. Adequacy and reporting of allocation concealment: review of recent trials published in four general medical journals. Brit Med J. 2005;330:1057–1058. - PMC - PubMed
    1. Rutjes AWS, Reitsma JB, Di Nisio M, Smidt N, van Rijn JC, Bossuyt PMM. Evidence of bias and variation in diagnostic accuracy studies. Can Med Assoc J. 2006;174 - PMC - PubMed

Publication types