

Giant oscillating thermopower at oxide interfaces
- PMID: 25813265
- PMCID: PMC4389223
- DOI: 10.1038/ncomms7678
Giant oscillating thermopower at oxide interfaces
Abstract
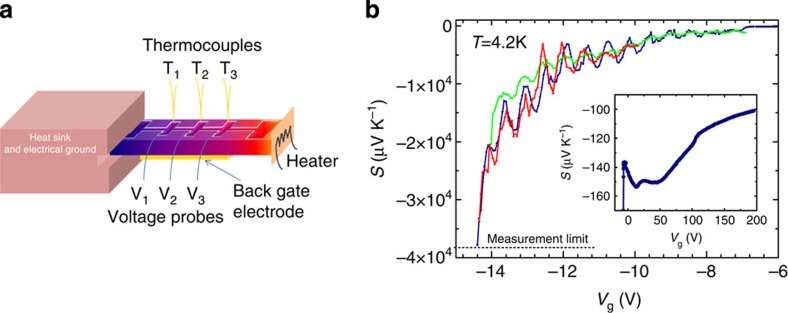
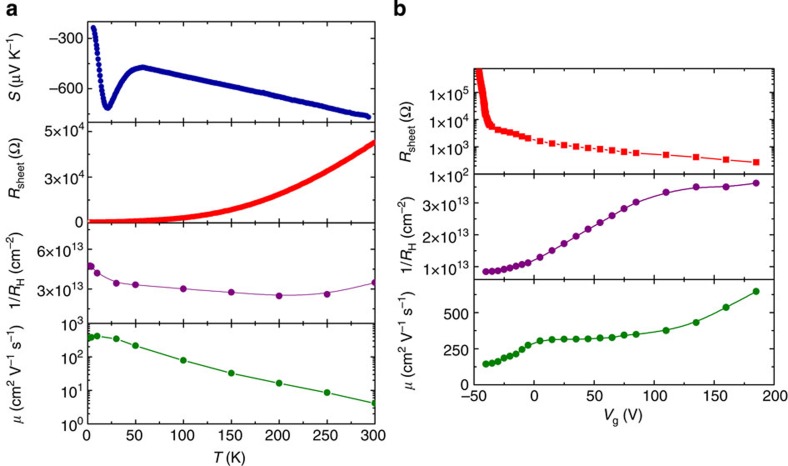
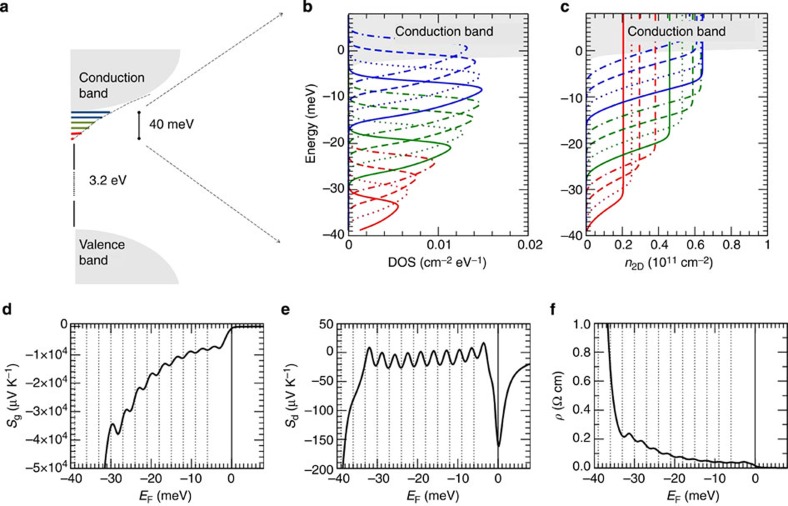
Understanding the nature of charge carriers at the LaAlO3/SrTiO3 interface is one of the major open issues in the full comprehension of the charge confinement phenomenon in oxide heterostructures. Here, we investigate thermopower to study the electronic structure in LaAlO3/SrTiO3 at low temperature as a function of gate field. In particular, under large negative gate voltage, corresponding to the strongly depleted charge density regime, thermopower displays high negative values of the order of 10(4)-10(5) μVK(-1), oscillating at regular intervals as a function of the gate voltage. The huge thermopower magnitude can be attributed to the phonon-drag contribution, while the oscillations map the progressive depletion and the Fermi level descent across a dense array of localized states lying at the bottom of the Ti 3d conduction band. This study provides direct evidence of a localized Anderson tail in the two-dimensional electron liquid at the LaAlO3/SrTiO3 interface.
Figures
Similar articles
-
Thermal and electrostatic tuning of surface phonon-polaritons in LaAlO3/SrTiO3 heterostructures.Nat Commun. 2023 Nov 24;14(1):7686. doi: 10.1038/s41467-023-43464-z. Nat Commun. 2023. PMID: 38001108 Free PMC article.
-
Large phonon drag thermopower boosted by massive electrons and phonon leaking in LaAlO3/LaNiO3/LaAlO3 heterostructure.Nano Lett. 2021 Nov 10;21(21):9240-9246. doi: 10.1021/acs.nanolett.1c03143. Epub 2021 Oct 28. Nano Lett. 2021. PMID: 34709840 Free PMC article.
-
Interface Fermi states of LaAlO3/SrTiO3 and related heterostructures.Phys Rev Lett. 2013 Mar 29;110(13):137601. doi: 10.1103/PhysRevLett.110.137601. Epub 2013 Mar 25. Phys Rev Lett. 2013. PMID: 23581372
-
Skin-Deep Aspect of Thermopower in Bi2Q3, PbQ, and BiCuQO (Q = Se, Te): Hidden One-Dimensional Character of Their Band Edges Leading to High Thermopower.Acc Chem Res. 2022 Oct 4;55(19):2811-2820. doi: 10.1021/acs.accounts.2c00255. Epub 2022 Sep 21. Acc Chem Res. 2022. PMID: 36129235
-
Optical Second Harmonic Generation on LaAlO3/SrTiO3 Interfaces: A Review.Materials (Basel). 2023 Jun 12;16(12):4337. doi: 10.3390/ma16124337. Materials (Basel). 2023. PMID: 37374522 Free PMC article. Review.
Cited by
-
Hidden lattice instabilities as origin of the conductive interface between insulating LaAlO3 and SrTiO3.Nat Commun. 2016 Sep 14;7:12773. doi: 10.1038/ncomms12773. Nat Commun. 2016. PMID: 27624682 Free PMC article.
-
Giant bipolar unidirectional photomagnetoresistance.Proc Natl Acad Sci U S A. 2022 Jul 5;119(27):e2115939119. doi: 10.1073/pnas.2115939119. Epub 2022 Jun 28. Proc Natl Acad Sci U S A. 2022. PMID: 35763578 Free PMC article.
-
Controlling Kondo-like Scattering at the SrTiO3-based Interfaces.Sci Rep. 2016 May 5;6:25455. doi: 10.1038/srep25455. Sci Rep. 2016. PMID: 27147407 Free PMC article.
-
Polaronic metal state at the LaAlO3/SrTiO3 interface.Nat Commun. 2016 Jan 27;7:10386. doi: 10.1038/ncomms10386. Nat Commun. 2016. PMID: 26813124 Free PMC article.
-
Prediction of a native ferroelectric metal.Nat Commun. 2016 Apr 4;7:11211. doi: 10.1038/ncomms11211. Nat Commun. 2016. PMID: 27040076 Free PMC article.
References
-
- Ohtomo A. & Hwang H. Y. A high-mobility electron gas at the LaAlO3/SrTiO3 heterointerface. Nature 427, 423–426 (2004) . - PubMed
-
- Caviglia A. D. et al.. Tunable Rashba spin-orbit interaction at oxide interfaces. Phys. Rev. Lett. 104, 126803 (2010) . - PubMed
-
- Fête A., Gariglio S., Caviglia A. D., Triscone J.-M. & Gabay M. Rashba induced magnetoconductance oscillations in the LaAlO3-SrTiO3 heterostructure. Phys. Rev. B 86, 201105(R) (2012) .
-
- Delugas P. et al.. Spontaneous 2-dimensional carrier confinement at the n-type SrTiO3/LaAlO3 interface. Phys. Rev. Lett. 106, 166807 (2011) . - PubMed
-
- Liao Y. C., Kopp T., Richter C., Rosch A. & Mannhart J. Metal-insulator transition of the LaAlO3-SrTiO3 interface electron system. Phys. Rev. B 83, 075402 (2011) .
Publication types
Grants and funding
LinkOut - more resources
Full Text Sources
Other Literature Sources
