. 2015 Jun;5(6):622-35.
doi: 10.1158/2159-8290.CD-14-0921. Epub 2015 Mar 26.

The p53 Target Gene SIVA Enables Non-Small Cell Lung Cancer Development

Affiliations

The p53 Target Gene SIVA Enables Non-Small Cell Lung Cancer Development

Jeanine L Van Nostrand et al. Cancer Discov. 2015 Jun.

Abstract

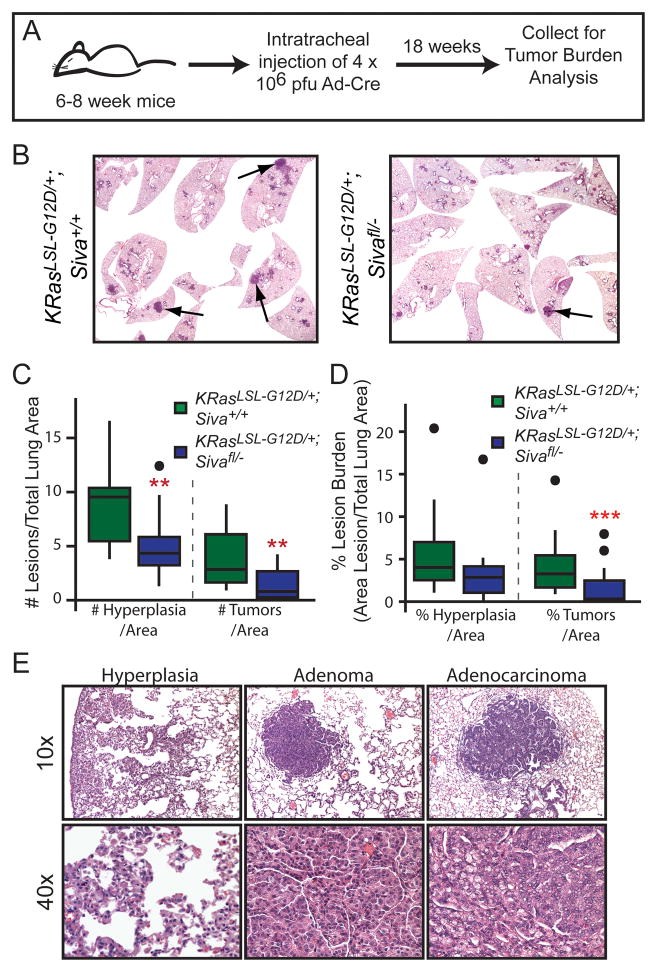
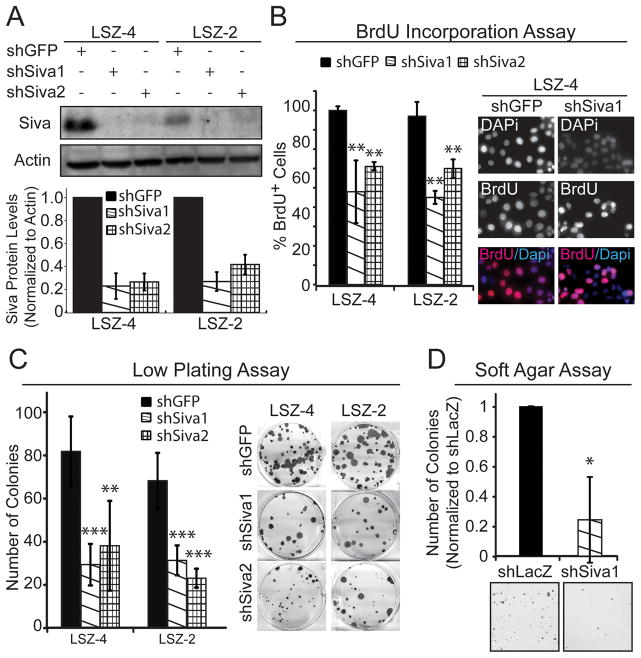
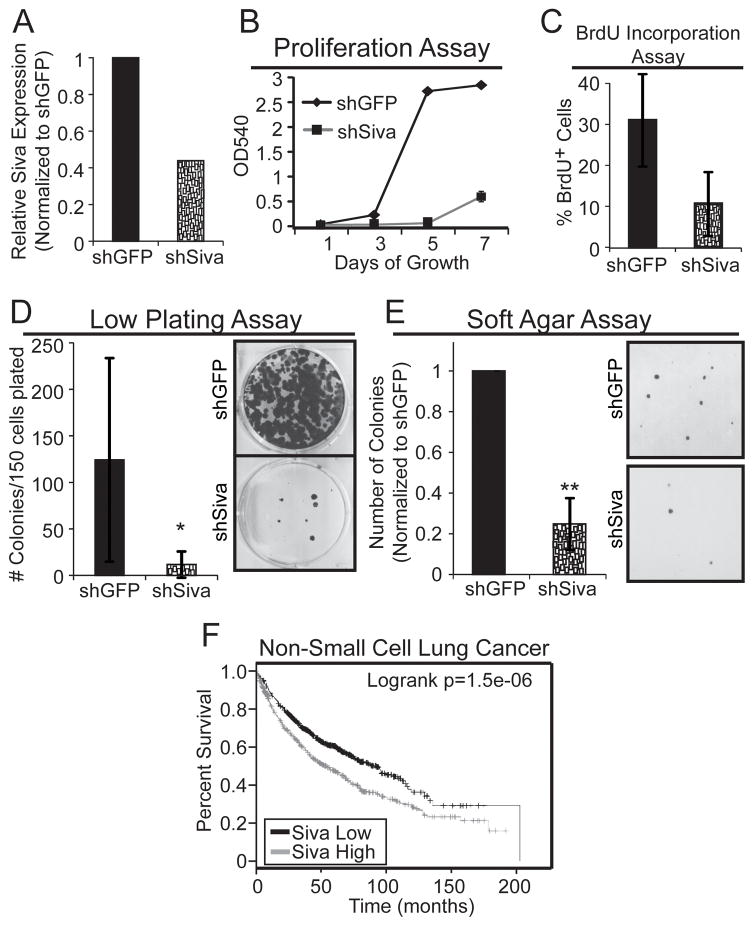
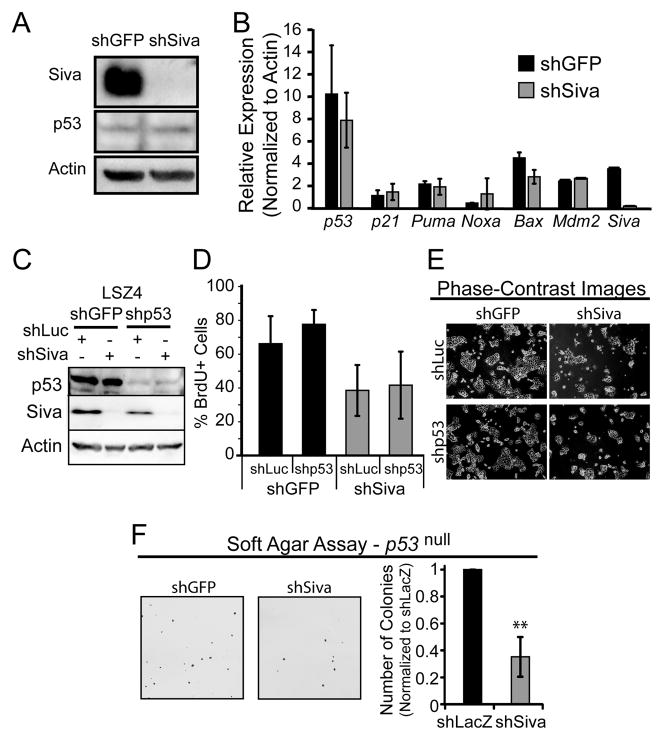
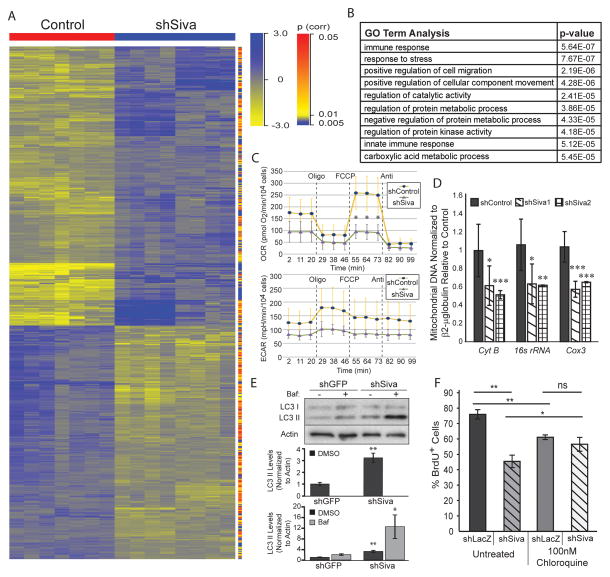
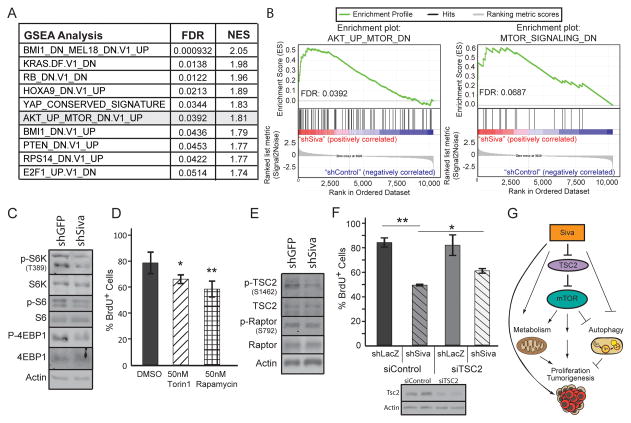
Although p53 transcriptional activation potential is critical for its ability to suppress cancer, the specific target genes involved in tumor suppression remain unclear. SIVA is a p53 target gene essential for p53-dependent apoptosis, although it can also promote proliferation through inhibition of p53 in some settings. Thus, the role of SIVA in tumorigenesis remains unclear. Here, we seek to define the contribution of SIVA to tumorigenesis by generating Siva conditional knockout mice. Surprisingly, we find that SIVA loss inhibits non-small cell lung cancer (NSCLC) development, suggesting that SIVA facilitates tumorigenesis. Similarly, SIVA knockdown in mouse and human NSCLC cell lines decreases proliferation and transformation. Consistent with this protumorigenic role for SIVA, high-level SIVA expression correlates with reduced NSCLC patient survival. SIVA acts independently of p53 and, instead, stimulates mTOR signaling and metabolism in NSCLC cells. Thus, SIVA enables tumorigenesis in a p53-independent manner, revealing a potential new cancer therapy target.

Significance: These findings collectively reveal a novel role for the p53 target gene SIVA both in regulating metabolism and in enabling tumorigenesis, independently of p53. Importantly, these studies further identify SIVA as a new prognostic marker and as a potential target for NSCLC cancer therapy.


Conflict of interest statement

Competing interests statement: The authors declare that they have no competing financial interests.

Figures

Figure 1
Figure 1. Generation of Siva Conditional Knockout Mice
A) Targeting scheme for generating Siva conditional knockout mice. The Siva-targeting vector contains a positive selection marker (Puromycin cassette (Puro)) flanked by loxP sites (triangles) and a negative selection marker (diphtheria toxin (dTA)). The four exons comprising the Siva locus (grey boxes) are flanked by LoxP and Lox-Puro-Lox sites on the 5′ and 3′ ends, respectively. The Puro cassette was removed in vivo by limited Cre expression, leaving a single 3′ LoxP site. Upon subsequent Cre recombinase expression, the Siva locus gets excised, resulting in a Siva null allele. These recombination events were detected by Southern blot analysis using Xmn1/EcoR1 restriction digests and subsequent probing with a 5′ or 3′ fragment external to the targeting vector. This leads to generation of fragments of different sizes in all cases, as shown. B1: BamH1, E1: EcoR1, Xm1: Xmn1, Xh1: Xho1 B) Southern blot analyses of mouse embryonic stem cells targeted at the Siva locus. Analyses of a wild-type (Siva+/+) and a targeted (Sivafl/+) ES cell clone are shown. DNA was digested with Xmn1/EcoR1. Left: Upon probing with the 3′ probe, the 11 Kb band indicates the wild-type allele and the 8.7 Kb band indicates the targeted conditional allele. Right: Upon probing with the 5′ probe, the 8.5 Kb band indicates the wild-type allele and the 4.5 Kb band indicates the targeted conditional allele. C) PCR analysis of recombined allele. Mouse embryonic fibroblasts generated from E13.5 Sivafl/− embryos (where fl denotes the conditional knockout allele) were infected either with Adenovirus expressing Cre (Ad-Cre) to excise the Siva floxed allele or with empty Adenovirus (Ad-Emp) as a control. Primers spanning the 5′ LoxP site (F1 and R1) or the remaining LoxP site after excision of the Siva locus (F1 and R2) were used. The absence of the floxed allele following Ad-Cre infection verifies the ability of Cre to fully excise the Siva locus.
Figure 2
Figure 2. Siva Deficiency Inhibits Lung Tumorigenesis
A) Schematic of the timeline for tumor study. 6–8 week old mice were infected with Ad-Cre via intratracheal injection, and lungs were analyzed 18 weeks later. B) Representative photomicrographs of lungs from KrasLSL-G12D;Siva+/+ (left, n=12) and KrasLSL-G12D;Sivafl/− (right, n=17) mice 18 weeks after Ad-Cre infection by intratracheal injection. C) Boxplot depicting the median number and quartiles of hyperplasias and tumors (adenomas and adenocarcinomas) per total lung area in KrasLSL-G12D;Siva+/+ and KrasLSL-G12D;Sivafl/− mice. Dots represent outlier data points. Hyperplasias: **p=0.008; Tumors **p=0.0058 by Wilcox Rank Sum Test between KrasLSL-G12D;Siva+/+ and KrasLSL-G12D;Sivafl/− mice. D) Boxplot depicting median tumor burden and quartiles calculated as tumor area per total lung area for hyperplasias and tumors (adenomas and adenocarcinomas). Dots represent outlier data points. Hyperplasia p=0.066; Tumor ***p= 0.003 by Wilcox Rank Sum Test between KrasLSL-G12D;Siva+/+ and KrasLSL-G12D;Sivafl/− mice. E) Representative photomicrographs of hyperplasias and tumors (adenomas and adenocarcinomas) taken at 100x and 400x magnification.
Figure 3
Figure 3. Siva Knockdown Inhibits Cellular Proliferation and Transformation in Mouse Non-Small Cell Lung Cancer Cells
A) (Top) Western blot analysis of SIVA in LSZ4 and LSZ2 Non-Small Cell Lung Cancer (NSCLC) cell lines. Two independent shRNAs targeting SIVA were used to knock-down SIVA. shRNA targeting GFP was used as a negative control. ACTIN serves as a loading control. (Bottom) Quantification of SIVA protein levels following expression of two Siva shRNAs compared to expression of shGFP, after normalization to ACTIN. B) (Left) Average percent BrdU incorporation upon Siva knockdown in LSZ4 and LSZ2 cells compared to control knockdown with shGFP. Error bars represent +/−SD. p-values by Student’s t-test comparing each shRNA to shGFP: LSZ4: **p=0.006, 0.002; LSZ2: **p=0.003, 0.007 (Right) Representative images of BrdU immunofluorescence. Blue: DAPI; Red: BrdU. C) (Left) Average number of colonies in low plating assay upon Siva knockdown in LSZ4 and LSZ2 cells compared to control knockdown with shGFP. Error bars represent +/−SD. p-values by Student’s t-test: LSZ4: ***p=0.0002; **p=0.0025; LSZ2: ***p=0.0004, 0.0001. (Right) Representative images of colonies in low plating assay stained with crystal violet. D) (Top) Average number of colonies in soft agar assay upon Siva knockdown in LSZ4 cells relative to control knockdown with shLacZ. Error bars represent +/−SD. *p-value by Student’s t-test: 0.047 (Bottom) Representative images of colonies in soft agar assay stained with Giemsa.
Figure 4
Figure 4. SIVA Knockdown Inhibits Cellular Proliferation and Transformation in Human Non-Small Cell Lung Cancer Cells
A) SIVA expression in A549 cells, as assessed by quantitative RT-PCR normalized to β-ACTIN, upon expression of shRNA targeting SIVA or shRNA targeting GFP. B) Representative cellular proliferation assay in A549 cells over 7 days following SIVA or control GFP shRNA transduction. The experiment was repeated in duplicate with two independent shRNAs to SIVA each time. C) Average percent BrdU incorporation in SIVA-knockdown cells. Error bars represent +/−SD. p-value by Student’s t-test: 0.058. D) (Left) Average number of colonies in low plating assay following SIVA or control GFP shRNA transduction. Error bars represent +/−SD. (Right) Representative images of colonies in low plating assay stained with crystal violet. *p-value by Student’s t-test: 0.05. E) (Left) Average number of colonies in soft agar assay upon knockdown of SIVA relative to control cells expressing shGFP. Error bars represent +/−SD. **p-value by Student’s t-test: 0.0013. (Right) Representative images of soft agar assay stained with Giemsa. F) Survival Curve from human Non-Small Cell Lung Cancer Patients generated using KMplot.com and gene expression from the SIVA1 probe 203489_at. SIVA expression levels: Low – Black; High – Red.
Figure 5
Figure 5. Phenotypes Induced by Siva Knockdown are p53-Independent
A) Western blot analysis of p53 levels upon Siva knockdown in LSZ4 cells. Western blot analysis for SIVA shows knockdown with shSiva relative to shGFP. ACTIN serves as a loading control. B) qRT-PCR analysis of p53 target gene expression, after normalization to β-actin, in NSCLC cells transduced with shSiva or shGFP. Error bars represent +/−SD. n=2. C) Western blot analysis of p53 and SIVA upon knockdown of p53 and/or Siva in LSZ4 cells. ACTIN was used as a loading control. D) Average of percent BrdU incorporation in LSZ4 cells upon knockdown of p53 and/or Siva. shGFP and shLuc served as controls. Error bars represent +/−SD. n=3. E) Phase-contrast images of LSZ4 cells upon knockdown of p53 and/or Siva. F) (Left) Images of colony formation in soft agar assays performed in p53 null NSCLC cells with knockdown of Siva. (Right) Average number of colonies formed relative to shLacZ transduced cells in soft agar assays. Error bars represent +/−S.D. n=3.
Figure 6
Figure 6. SIVA loss decreases metabolic function of NSCLC cells
A) Heat map of gene expression based on hierarchical clustering of microarray data from LSZ2 and LSZ4 cells with control knock-down using two control hairpins (shGFP and shLacZ) (Red) or knock-down of Siva using two independent hairpins (shSiva1 and shSiva2) (Blue). Genes identified for the heat map were significantly modulated (p-value less than or equal to 0.05) and had a fold change equal to or greater than 1.5. Yellow signifies downregulated genes while Blue signifies upregulated genes. p-value for each gene is denoted on the right hand side with either red (high) or blue (low) bars. B) GO Term analysis of genes with altered expression upon Siva shRNA transduction into LSZ2 and LSZ4 cells relative to cells with control shRNA transduction. The p-value for each category is shown on the right side. GO term analysis was performed using GeneSpring-GX software (Agilent). C) Oxygen consumption rate (OCR) and extracellular acidification rate (ECAR) in LSZ4 cells upon Siva knockdown or in shGFP transduced control cells. Oligo: oligomycin (ATP synthase inhibitor [electron chain inhibitor]), FCCP (uncoupler), Anti: antimycin (electron gradient disrupter). *p-value by Student’s t-test: 0.024 D) Mitochondrial DNA content assessed by quantitative PCR for mitochondrial-encoded genes upon knockdown of Siva in LSZ4 cells and in shGFP transduced control cells. Normalized to β2-microglobulin. E) (Top) Western blot analysis of autophagy related protein LC3-II in LSZ4 cells upon shSiva or shGFP control transduction. ACTIN used as a loading control. (Bottom) Quantification of LC3-II levels upon Siva knockdown without (top) and with Bafilomycin A1 (bottom), relative to β-ACTIN. p-value by Student’s t-test: *0.05, **0.007. F) Average percent BrdU incorporation in LSZ-4 cells with control (shLacZ) or Siva (shSiva) knockdown in the absence (untreated) or presence of chloroquine. Cells were incubated with 100nM chloroquine for 18 hours prior to BrdU pulse. Graph represents average +/− SD of three experiments. *p-value<0.05; **p-value<0.01; ns: not significant by Student’s t-test. n=3.
Figure 7
Figure 7. SIVA loss decreases metabolic function of NSCLC cells
A) Gene Set Enrichment Analysis (GSEA) of genes with altered expression upon Siva shRNA transduction into LSZ2 and LSZ4 cells relative to cells with control shRNA transduction. The FDR p-value and normalized enrichment score (NES) for each category are shown on the right side. The GSEA signature for decreased mTOR signaling is highlighted in grey. B) Select GSEA profiles (Left) Enrichment of genes upregulated upon mTOR inhibition in the presence of AKT upregulation. FDR q-value: 0.039 (Right) Enrichment of genes downregulated upon mTOR activation. FDR q-value: 0.069 C) Western blot analysis of mTOR signaling targets in LSZ4 cells upon shSiva or shGFP control transduction. ACTIN serves as a loading control. D) Average percent BrdU incorporation in LSZ-4 cells treated with 50nM Torin1 or 50nM Rapamycin for 18 hours. Error bars represent +/−SD. p-value by Student’s t-test: *Torin1: 0.048; **Rapamycin: 0.009. E) Western blot analysis of mTOR upstream signaling components in LSZ4 cells upon shSiva or shGFP control transduction. ACTIN serves as a loading control. F) Average percent BrdU incorporation in LSZ-4 cells with control (shLacZ) or Siva (shSiva) knockdown and without (siControl) or with TSC2 (siTSC2) knockdown. Error bars represent +/−SD *p-value<0.05; **p-value<0.01 by Student’s t-test. G) Model depicting the role of SIVA in promoting tumorigenesis through activation of mTOR signaling, which can itself affect metabolism, proliferation, tumorigenesis and autophagy. SIVA may also have mTOR-independent effects on these processes.

Comment in

  • Two Faces of SIVA.
    Resnick-Silverman L, Manfredi JJ. Resnick-Silverman L, et al. Cancer Discov. 2015 Jun;5(6):581-3. doi: 10.1158/2159-8290.CD-15-0484. Cancer Discov. 2015. PMID: 26037915 Free PMC article.

References

    1. Vousden KH, Prives C. Blinded By The Light: The Growing Complexity of p53. Cell. 2009;137(3):413–31. - PubMed
    1. Carvajal LA, Manfredi JJ. Another Fork in the Road—Life Or Death Decisions by the Tumour Suppressor p53. Embo Rep. 2013;14(5):414–21. - PMC - PubMed
    1. Kenzelmann Broz D, Mello SS, Bieging KT, Jiang D, Dusek RL, Brady CA, et al. Global Genomic Profiling Reveals an Extensive p53-Regulated Autophagy Program Contributing to Key p53 Responses. Genes & Development. 2013;27(9):1016–31. - PMC - PubMed
    1. Bieging KT, Mello SS, Attardi LD. Unravelling Mechanisms of p53-Mediated Tumour Suppression. Nature Reviews. 2014;14(5):359–70. - PMC - PubMed
    1. Brady CA, Jiang D, Mello SS, Johnson TM, Jarvis LA, Kozak MM, et al. Distinct p53 Transcriptional Programs Dictate Acute DNA-Damage Responses and Tumor Suppression. Cell. 2011;145(4):571–83. doi: 10.1016/J.Cell.2011.03035. - DOI - PMC - PubMed

Publication types

MeSH terms

Substances