. 2015 Apr 15;142(8):1418-30.
doi: 10.1242/dev.109496. Epub 2015 Mar 26.

Brg1 modulates enhancer activation in mesoderm lineage commitment

Affiliations

Brg1 modulates enhancer activation in mesoderm lineage commitment

Jeffrey M Alexander et al. Development. .

Abstract

The interplay between different levels of gene regulation in modulating developmental transcriptional programs, such as histone modifications and chromatin remodeling, is not well understood. Here, we show that the chromatin remodeling factor Brg1 is required for enhancer activation in mesoderm induction. In an embryonic stem cell-based directed differentiation assay, the absence of Brg1 results in a failure of cardiomyocyte differentiation and broad deregulation of lineage-specific gene expression during mesoderm induction. We find that Brg1 co-localizes with H3K27ac at distal enhancers and is required for robust H3K27 acetylation at distal enhancers that are activated during mesoderm induction. Brg1 is also required to maintain Polycomb-mediated repression of non-mesodermal developmental regulators, suggesting cooperativity between Brg1 and Polycomb complexes. Thus, Brg1 is essential for modulating active and repressive chromatin states during mesoderm lineage commitment, in particular the activation of developmentally important enhancers. These findings demonstrate interplay between chromatin remodeling complexes and histone modifications that, together, ensure robust and broad gene regulation during crucial lineage commitment decisions.

Keywords: Chromatin; Enhancers; Gene expression; Histone modification; Mesoderm; Stem cells.


Figures

Fig. 1.
Fig. 1.
Brg1 is required for directed differentiation of ESCs to cardiomyocytes (CMs). (A) Heat map representation of clustering analysis of RNA expression of chromatin regulators at four stages of directed CM differentiation identifies three expression patterns. Chromatin regulators include genes annotated with GO terms GO0006338 and GO00016569 and additional known regulators. (B) Western blot analysis demonstrates reduced abundance of Brg1 at late stages of CM differentiation. Lysate from the adrenal carcinoma SW13, which does not express Brg1, was used as a negative control. Actin was used as a loading control. (C) Western blot analysis of a 4-OHT treatment time course in Brg1f/f; Actin-CreER ESCs. Loss of Brg1 expression is near complete after 48 h of 4-OHT treatment. (D) Control (vehicle only, THF) or 4-OHT was added after 2, 4 and 8 days of differentiation to mediate Brg1 deletion, and the presence of cardiomyocytes was determined by immunofluorescence for cTnT at day 12. Scale bar: 50 µm. (E) Comparison of percentage of cTnT+ cells for control or 4-OHT-treated cultures measured by flow cytometry. *P<0.05, ***P<0.001; one-sample t-test.
Fig. 2.
Fig. 2.
Brg1 is required for robust induction of mesodermal markers. (A) Flow cytometry for Pdgfra and Flk-1 at day 4 of differentiation demonstrates a lower percentage of cells expressing these mesoderm markers in cultures deleted for Brg1. (B) Quantitative PCR demonstrates reduced expression of Mesp1 in day 4 cultures depleted for Brg1. ***P<0.001; Student's t-test.
Fig. 3.
Fig. 3.
Global expression analysis of Brg1-deleted mesodermal cultures reveals dysregulation of essential developmental genes. (A) Cartoon of the RNA-seq experimental design. (B) Day 4 expression in control samples plotted versus day 4 expression in 4-OHT-treated samples. Genes significantly changed (>twofold change, FDR=1%) are colored in red and green for upregulated and downregulated, respectively. Example genes are highlighted.
Fig. 4.
Fig. 4.
Brg1 is required for gene activation and maintenance of gene silencing during mesoderm differentiation. (A) Heat map of log2-fold change in expression during mesoderm differentiation for genes significantly downregulated or upregulated by loss of Brg1. (B) (Top) Genes are rank-ordered based on log2-fold change in expression between day 4 control and day 2 (normal mesoderm differentiation). Only genes significantly changed during mesoderm differentiation are shown. (Bottom) Color bars depict distribution of genes downregulated by loss of Brg1 by numerous fold change cut-offs. Colors vary only for ease of visualization and do not correlate to numerical values. Each vertical line represents a single dysregulated gene. Genes downregulated by loss of Brg1 cluster to the right, suggesting a role for Brg1 in gene activation during mesoderm differentiation. Conversely, genes upregulated by loss of Brg1 are more often found repressed during mesoderm differentiation. N indicates the number of Brg1-dependent genes shown.
Fig. 5.
Fig. 5.
Brg1 co-localizes with H3K27ac genome-wide. (A) Density of ChIP-seq reads for H3K27ac, anti-FLAG ChIP-seq and anti-Brg1 ChIP-exo in Brg1-FLAG ESCs, and anti-Brg1 ChIP-exo in THF- and 4-OHT-treated Brg1fl/fl ESCs. Plots show ±5 kb around the midpoint of each Brg1-enriched region ranked according to H3K27ac density, and demonstrate significant co-localization of Brg1 with H3K27ac. Brg1 is detected at these regions across distinct cell lines and ChIP antibodies, and is lost upon genetic deletion. (B) Distribution of Brg1-enriched regions across the mouse genome. (C) Overlap between genes with Brg1 enrichment within 2.5 kb of the TSS and genes dysregulated by loss of Brg1 demonstrates little overlap between Brg1-dependent genes and Brg1-bound promoters. (D) Co-localization of Brg1 and H3K27ac at example genomic regions. y-axis shows reads per bin per million. (E) Motifs enriched at Brg1-occupied enhancer elements. TRANSFAC positional Weight Matrices for each significantly (q<0.001) enriched motif is shown next to transcription factors known to bind these motifs that are expressed at the mesoderm stage (interquartile range-normalized RPKM values are shown). Known regulatory interactions, as identified using the Ingenuity Pathway analysis, are also annotated for each gene.
Fig. 6.
Fig. 6.
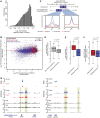
Brg1 is required for enhancer activation in differentiating mesodermal cultures. (A) Histogram of log2-fold change in H3K27ac at predicted enhancers. (B) Scatterplot of log2-fold change of H3K27ac at predicted enhancers and the log2-fold change in gene expression between day 4 4-OHT and day 4 control cultures of the nearest gene to each enhancer plotted. Red and blue dots highlight enhancers marked by H3K27ac in undifferentiated ESCs and mesodermal cultures (static enhancers), and those marked in mesoderm cultures only (activated enhancers), respectively. (C) Box plots of log2-fold change of subsets of predicted enhancers with read density profiles of each enhancer cohort. Enhancers associated with downregulated genes include enhancers of which the most proximal gene is significantly downregulated in Brg1-deleted mesoderm. Downregulated gene-associated enhancers show greater average loss in H3K27ac than all enhancers. (D) Box plots of log2-fold change in H3K27ac for predicted enhancers in Brg1-deficient cultures. Enhancers are separated into Brg1-bound and unbound cohorts based on the presence or absence of a Brg1-enriched region, respectively. (E,F) Box plots of log2-fold change in H3K27ac (E) or expression of the nearest gene (F) for static and activated enhancers in Brg1-deficient cultures. (G) H3K27ac at putative enhancer regions proximal to the Mesp1 and Cyp26a1 genes. y-axis shows reads per bin per million.
Fig. 7.
Fig. 7.
Brg1 is required for H3K27me3 levels at derepressed developmental regulators. (A) Density of ChIP-seq reads for H3K27ac and H3K27me3±5 kb of the TSS of upregulated genes. Regions are ranked according to H3K27me3 density. Right bar indicates distribution of developmental transcription factors (TFs). Most developmental TFs are marked by H3K27me3 and not by H3K27ac. (B) Example genomic regions with loss of H3K27me3 at derepressed genes. y-axis denotes reads per bin per million. (C,D) (Left) Average ChIP-seq or input signal from control or 4-OHT-treated cultures at promoters of group I genes for (C) H3K27me3 or (D) Suz12. (Right) Box plot of normalized (C) H3K27me3 or (D) Suz12 ChIPseq read density at group I gene promoters (±5 kb of TSS) for day 4 control (blue) or day 4 4-OHT (red). Significance between groups was determined using a two-sided paired Mann–Whitney U-test.
Fig. 8.
Fig. 8.
Summary model. (A) Dynamic expression of Brg1 during cardiac differentiation peaks at the mesoderm stage. Brg1 function is most crucial during the mesoderm-induction stage. (B,C) Mechanisms of Brg1 function during mesoderm induction. (B) Brg1 is required for silent or poised enhancer to transition to an H3K27ac+ active state. (C) Brg1 is required at non-mesodermal genes to promote Polycomb complex-mediated repression.

References

    1. Agalioti T., Lomvardas S., Parekh B., Yie J., Maniatis T. and Thanos D. (2000). Ordered recruitment of chromatin modifying and general transcription factors to the IFN-beta promoter. Cell 103, 667-678 10.1016/S0092-8674(00)00169-0 - DOI - PubMed
    1. Attanasio C., Nord A. S., Zhu Y., Blow M. J., Biddie S. C., Mendenhall E. M., Dixon J., Wright C., Hosseini R., Akiyama J. A. et al. (2014). Tissue-specific SMARCA4 binding at active and repressed regulatory elements during embryogenesis. Genome Res. 24, 920-929 10.1101/gr.168930.113 - DOI - PMC - PubMed
    1. Aulehla A. and Pourquié O. (2010). Signaling gradients during paraxial mesoderm development. Cold Spring Harb. Perspect. Biol. 2, a000869 10.1101/cshperspect.a000869 - DOI - PMC - PubMed
    1. Bultman S., Gebuhr T., Yee D., La Mantia C., Nicholson J., Gilliam A., Randazzo F., Metzger D., Chambon P., Crabtree G. et al. (2000). A Brg1 null mutation in the mouse reveals functional differences among mammalian SWI/SNF complexes. Mol. Cell 6, 1287-1295 10.1016/S1097-2765(00)00127-1 - DOI - PubMed
    1. Bultman S. J., Gebuhr T. C. and Magnuson T. (2005). A Brg1 mutation that uncouples ATPase activity from chromatin remodeling reveals an essential role for SWI/SNF-related complexes in beta-globin expression and erythroid development. Genes Dev. 19, 2849-2861 10.1101/gad.1364105 - DOI - PMC - PubMed

Publication types

MeSH terms

Associated data