. 2015 Apr 15;142(8):1542-52.
doi: 10.1242/dev.118786. Epub 2015 Mar 26.

SNPfisher: tools for probing genetic variation in laboratory-reared zebrafish

Affiliations

SNPfisher: tools for probing genetic variation in laboratory-reared zebrafish

Matthew G Butler et al. Development. .

Abstract

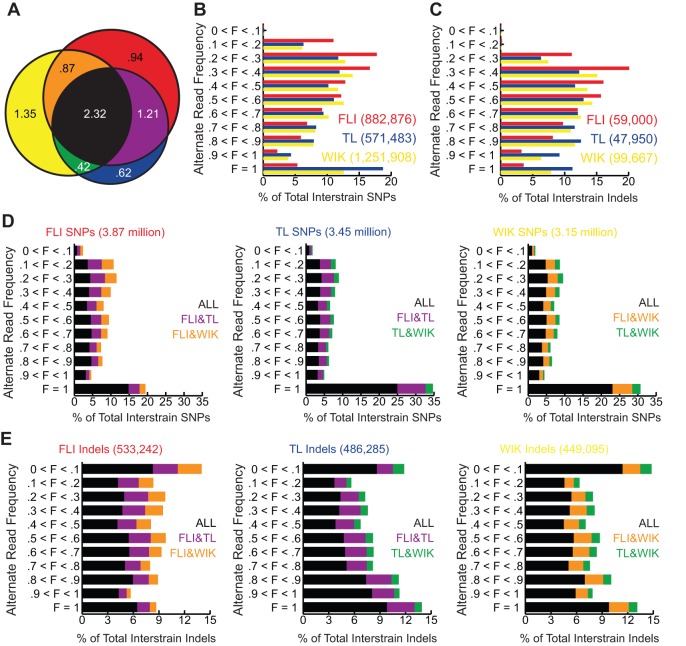
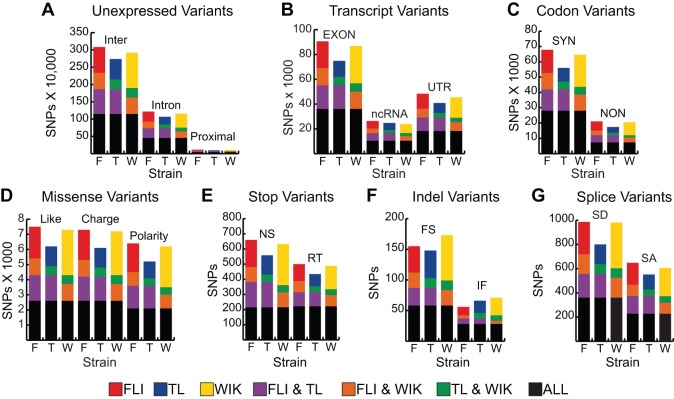
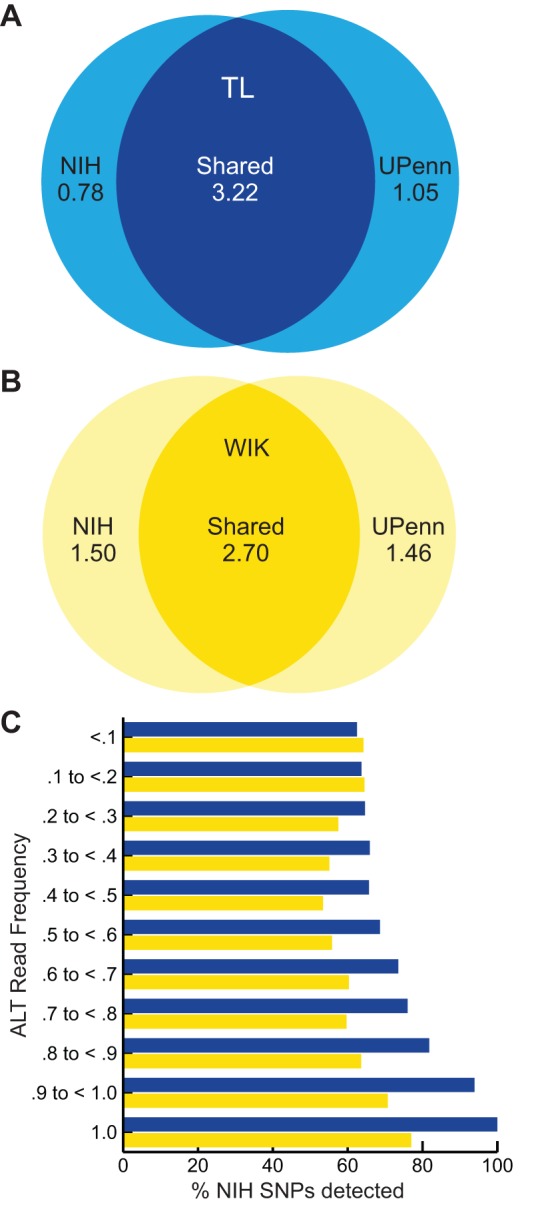
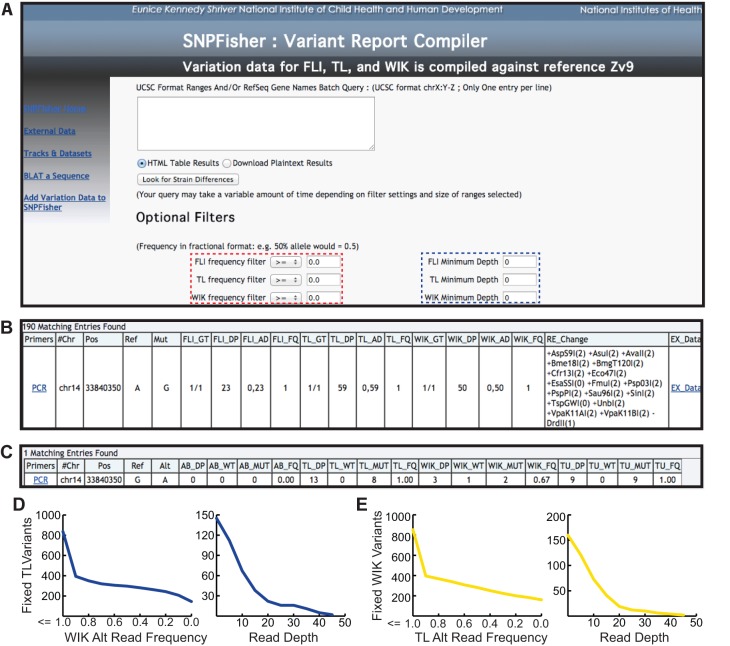
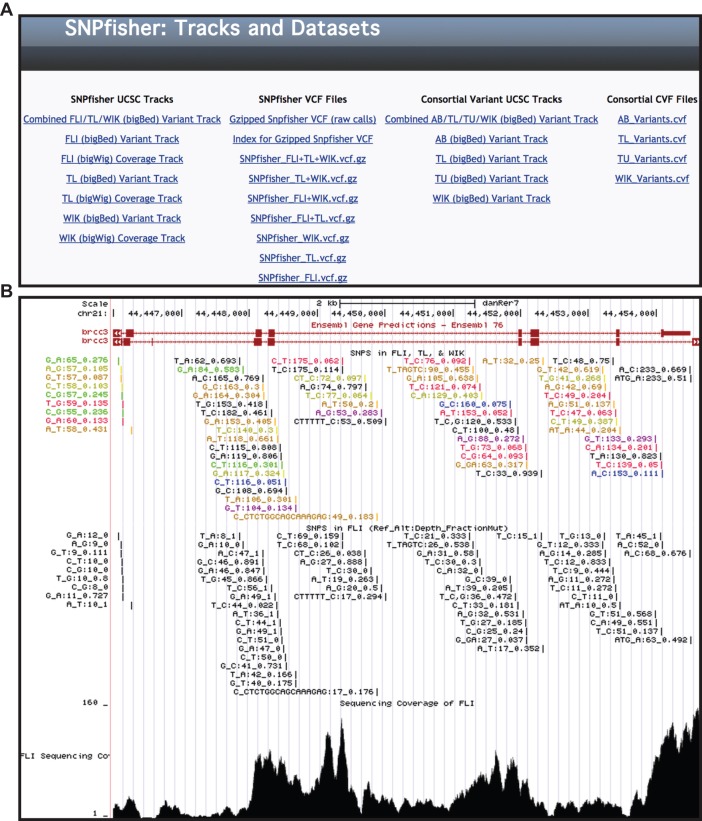
Single nucleotide polymorphisms (SNPs) are the benchmark molecular markers for modern genomics. Until recently, relatively few SNPs were known in the zebrafish genome. The use of next-generation sequencing for the positional cloning of zebrafish mutations has increased the number of known SNP positions dramatically. Still, the identified SNP variants remain under-utilized, owing to scant annotation of strain specificity and allele frequency. To address these limitations, we surveyed SNP variation in three common laboratory zebrafish strains using whole-genome sequencing. This survey identified an average of 5.04 million SNPs per strain compared with the Zv9 reference genome sequence. By comparing the three strains, 2.7 million variants were found to be strain specific, whereas the remaining variants were shared among all (2.3 million) or some of the strains. We also demonstrate the broad usefulness of our identified variants by validating most in independent populations of the same laboratory strains. We have made all of the identified SNPs accessible through 'SNPfisher', a searchable online database (snpfisher.nichd.nih.gov). The SNPfisher website includes the SNPfisher Variant Reporter tool, which provides the genomic position, alternate allele read frequency, strain specificity, restriction enzyme recognition site changes and flanking primers for all SNPs and Indels in a user-defined gene or region of the zebrafish genome. The SNPfisher site also contains links to display our SNP data in the UCSC genome browser. The SNPfisher tools will facilitate the use of SNP variation in zebrafish research as well as vertebrate genome evolution.

Keywords: Danio rerio; Genome; Next-generation sequencing; SNP; Variation; Whole-genome sequencing; Zebrafish.


Figures

Fig. 1.
Fig. 1.
Natural SNP and Indel variation in laboratory zebrafish. (A) Venn diagram demonstrating the number of positions in the zebrafish genome with alternate alleles specific to or shared between the FLI, TL and WIK strains as compared with the Zv9 reference genome. Numbers are in millions. See below for key to color scheme. (B,C) The numbers of strain-specific SNP (B) and Indel (C) variants (red, blue and yellow color-coded categories of variants shown in A) as percentages of total number of strain-specific variants (on the x-axis) and grouped by alternate allele read frequency (on the y-axis). The total number of strain-specific variants for each strain is shown in parentheses to the right of the name of each strain. (D,E) The numbers of shared SNP (D) and Indel (E) variants (purple, green, orange and black color-coded categories of variants shown in A), as percentages of total number of shared variants (on the x-axis) and grouped by observed alternate allele read frequency (on the y-axis). The total number of variants is shown above each graph and the color scheme is shown to the right. The color code in all panels denotes which strain or strains contain(s) a variant at a given position (at any frequency) relative to the Zv9 reference: Red, present in only FLI; blue, present in only TL; yellow, present in only WIK; purple, present in FLI and TL, but not in WIK; green, present in TL and WIK, but not in FLI; orange, present in FLI and WIK, but not in TL; black, present in all three strains. F, alternate allele read frequency.
Fig. 2.
Fig. 2.
Spectrum of natural genetic variation in laboratory zebrafish. The number of SNPs or Indels per category. (A) Unexpressed variants, including intergenic (Inter), intronic (Intron) and within 5 kb of a transcript (Proximal) variants. (B) Transcript variants, including those falling in exons, non-coding RNA (ncRNA), and untranslated regions (UTR). (C) Codon variants, divided into synonymous (SYN) and non-synonymous (NON) changes. (D) Missense variants, divided into conservative changes, e.g. nonpolar-to-nonpolar (Like), charge changes, e.g. polar-to-positive (Charge) and polarity changes, e.g. polar-to-nonpolar (Polarity). (E) Stop codon variants, divided into nonsense (NS) and read-through (RT) alleles. (F) Indel variants within coding sequences, divided by whether they result in frameshift (FS) or in-frame (IF) alleles. (G) Splice site-altering variants, including those that alter splice donor dinucleotides (SD) and those that alter splice acceptor dinucleotides (SA). Color scheme used is as in Fig. 1, and is also noted at the bottom of this figure.
Fig. 3.
Fig. 3.
Variant sharing between independent populations of TL and WIK. (A,B) Venn diagrams showing the number of SNPs shared (overlapping areas) or not shared (non-overlapping areas) between independent isolates of the TL (A) and WIK (B) strains maintained at the NIH (leftmost circle) and UPenn (rightmost circle). (C) A stacked bar graph showing the percentage of total NIH SNPs also detected in the UPenn SNP dataset (x-axis), grouped by frequency category (y-axis). Frequency is calculated by dividing the number of alternate allele reads per total reads from the NIH strains. Values for the TL and WIK strains are shown in blue and yellow, respectively.
Fig. 4.
Fig. 4.
SNPfisher homepage and variant report compiler tool. (A) Screen shot of the SNPfisher homepage featuring the SNPfisher Variant Report Compiler. Users can define frequency values (dashed red box) and minimum read depth values (dashed blue box) for each strain in any gene or genomic region entered into the query box (white box in center). The drop-down filtering menus include ‘=’, ‘<’, ‘>’, ‘≤’ and ‘≥’ to adjust variant frequencies. (B) A variant annotation generated by the SNPfisher Variant Report Compiler homepage. The Primers column contains links to the ‘Primer3’ web interface to generate primers for amplification of the variant. The genotype (GT) value corresponds to genotype of the population of fish surveyed (0/0=ref. allele homozygote, 0/1=alt. allele heterozygote, 1/1=alt. allele homozygote). The allele distribution (AD) is composed of the number of ref. allele reads and then alt. allele reads separated by commas, respectively. Alt. allele read frequencies (FQ) were calculated by dividing the alt. allele reads by the total number of reads at a given position. Variants encoding RFLPs are documented in the RE_Changes column. The creation (+) or destruction (−) of a site is indicated prior to the restriction enzyme name. The number in parentheses following the restriction enzyme name indicates the number of restrictions recognition sites in the 800 bp surrounding the variant (400 bp upstream and downstream) in the Zv9 reference genome sequence. (C) An example of the variant annotation provided by the Ex_Data link in the SNPfisher report. The total read depth (DP), ref. allele read depth (WT), alt. allele read depth (MUT) and alt. allele read frequency (FQ) values represent the cumulative read sums calculated from published datasets. (D,E) Scatterplots demonstrate TL and WIK variant filtration in the cloche crucial region. The number of fixed TL variants (y-axis in left plot of D) decreases by filtering for lower alternate (Alt) allele read frequencies in WIK (x-axis). Increasing read depth (x-axis in right plot of D) decreases fixed TL variants absent in WIK (x-axis). Similar results are obtained for WIK variants in the cloche region (E).
Fig. 5.
Fig. 5.
SNPfisher tracks and dataset page. (A) Screen shot of SNPfisher ‘Tracks and Datasets’ page containing UCSC genome track links (columns 1 and 3) and downloadable datasets in VCF (column 2) and CVF format (column 4). The bigBed file hyperlinks (Combined FLI/TL/WIK, FLI, TL, WIK) display variation data and the bigWig files (FLI, TL and WIK) show base-by-base sequencing coverage for each strain in the UCSC genome browser. CVF variants were also formatted for display in the UCSC genome browser (column 3). (B) Screen shot of the brcc3 locus (Miskinyte et al., 2011) in the UCSC genome browser, in which SNP and Indel variation is demonstrated with the Combined FLI/TL/WIK Variant Track (top), the FLI Variant Track (middle) and the FLI Coverage Track (bottom). Variant annotations are formatted by Ref. Allele_Alt. Allele:Read Depth_Alt. Allele Read Frequency. In the Combined FLI/TL/WIK Variant Track, the strain distribution is annotated by color (FLI, red; TL, blue; WIK, yellow; FLI&TL, purple; FLI&WIK, orange; TL&WIK, green; ALL, black), and depth and alt allele read frequency are calculated from reads from all three strains.

References

    1. Abecasis G. R., Altshuler D., Auton A., Brooks L. D., Durbin R. M., Gibbs R. A., Hurles M. E. and McVean G. A. (2010). A map of human genome variation from population-scale sequencing. Nature 467, 1061-1073 10.1038/nature09534 - DOI - PMC - PubMed
    1. Abecasis G. R., Auton A., Brooks L. D., DePristo M. A., Durbin R. M., Handsaker R. E., Kang H. M., Marth G. T. and McVean G. A. (2012). An integrated map of genetic variation from 1,092 human genomes. Nature 491, 56-65 10.1038/nature11632 - DOI - PMC - PubMed
    1. Bowen M. E., Henke K., Siegfried K. R., Warman M. L. and Harris M. P. (2012). Efficient mapping and cloning of mutations in zebrafish by low-coverage whole-genome sequencing. Genetics 190, 1017-1024 10.1534/genetics.111.136069 - DOI - PMC - PubMed
    1. Bradley K. M., Elmore J. B., Breyer J. P., Yaspan B. L., Jessen J. R., Knapik E. W. and Smith J. R. (2007). A major zebrafish polymorphism resource for genetic mapping. Genome Biol. 8, R55 10.1186/gb-2007-8-4-r55 - DOI - PMC - PubMed
    1. Chang N., Sun C., Gao L., Zhu D., Xu X., Zhu X., Xiong J.-W. and Xi J. J. (2013). Genome editing with RNA-guided Cas9 nuclease in zebrafish embryos. Cell Res. 23, 465-472 10.1038/cr.2013.45 - DOI - PMC - PubMed

Publication types

MeSH terms

LinkOut - more resources