. 2015 Mar 31;65(12):1199-1214.
doi: 10.1016/j.jacc.2015.01.031.

Cofilin-2 phosphorylation and sequestration in myocardial aggregates: novel pathogenetic mechanisms for idiopathic dilated cardiomyopathy

Affiliations

Cofilin-2 phosphorylation and sequestration in myocardial aggregates: novel pathogenetic mechanisms for idiopathic dilated cardiomyopathy

Khaushik Subramanian et al. J Am Coll Cardiol. .

Erratum in

  • J Am Coll Cardiol. 2015 May 12;65(18):2056

Abstract

Background: Recently, tangles and plaque-like aggregates have been identified in certain cases of dilated cardiomyopathy (DCM), traditionally labeled idiopathic (iDCM), where there is no specific diagnostic test or targeted therapy. This suggests a potential underlying cause for some of the iDCM cases. [Corrected]

Objectives: This study sought to identify the make-up of myocardial aggregates to understand the molecular mechanisms of these cases of DCM; this strategy has been central to understanding Alzheimer's disease.

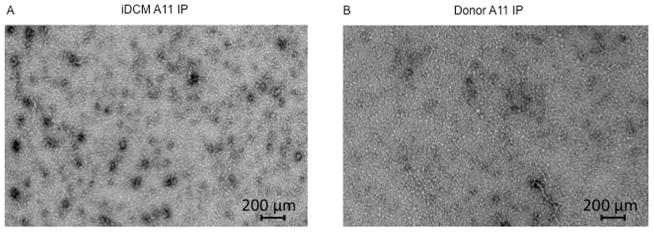
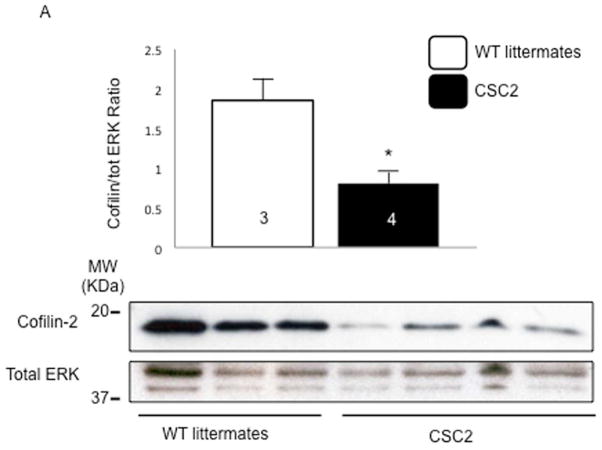
Methods: Aggregates were extracted from human iDCM samples with high congophilic reactivity (an indication of plaque presence), and the findings were validated in a larger cohort of samples. We tested the expression, distribution, and activity of cofilin in human tissue and generated a cardiac-specific knockout mouse model to investigate the functional impact of the human findings. We also modeled cofilin inactivity in vitro by using pharmacological and genetic gain- and loss-of-function approaches.

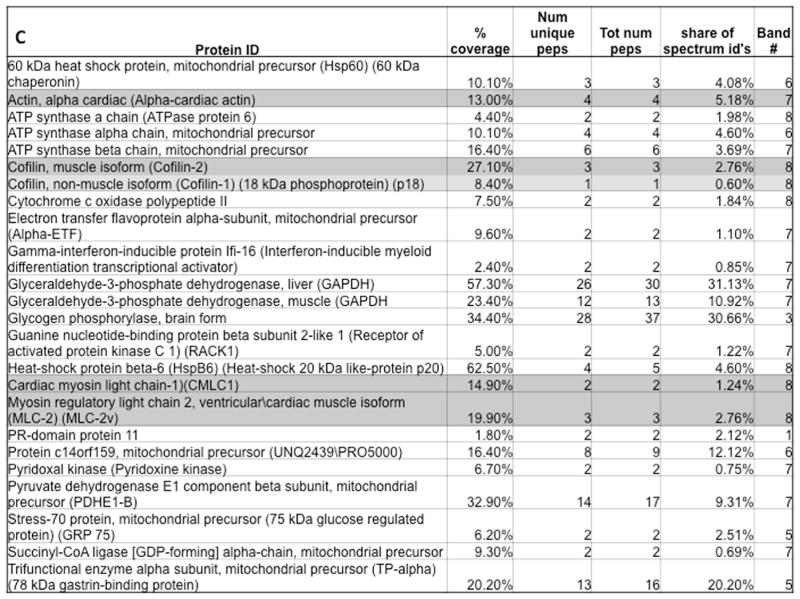
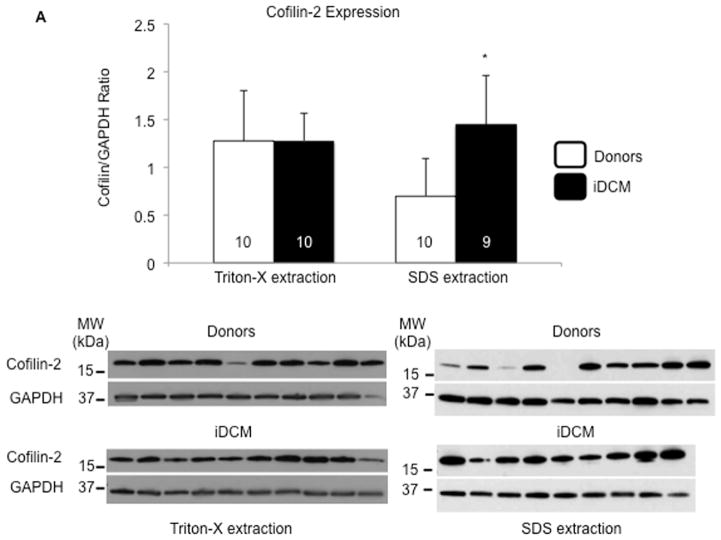
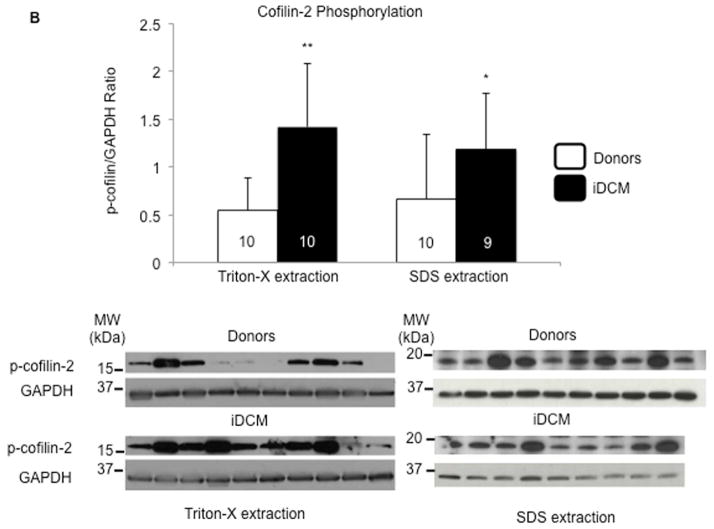
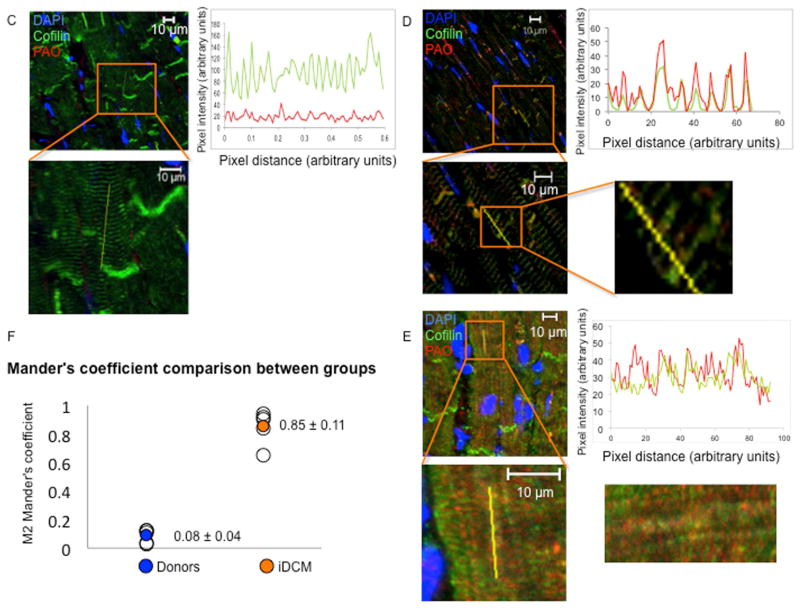
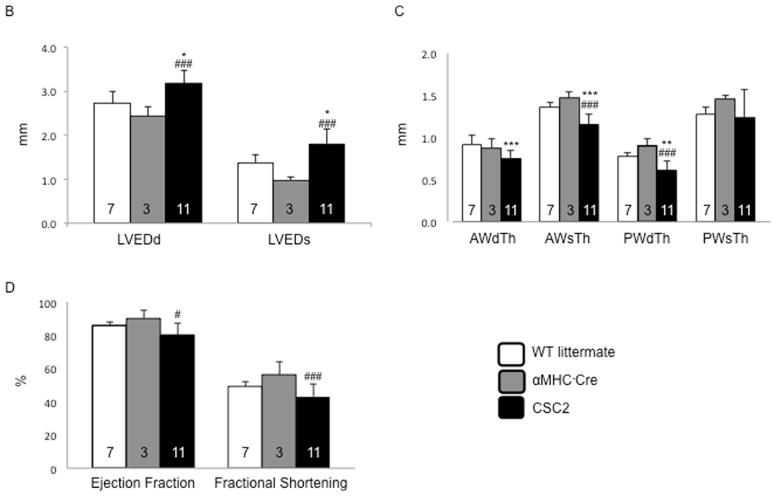
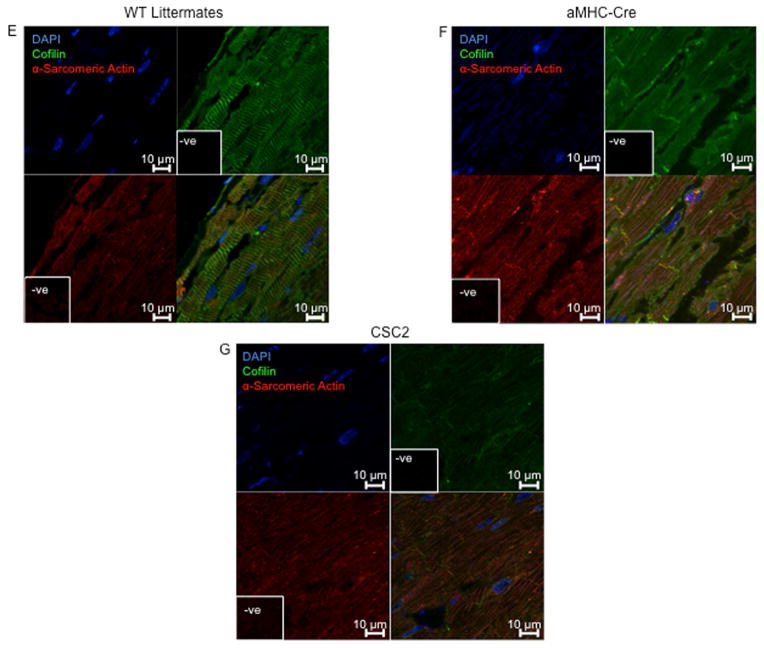
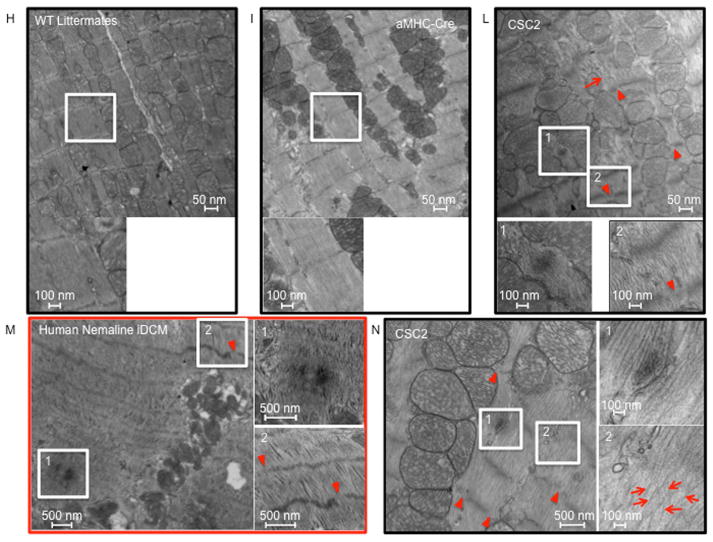
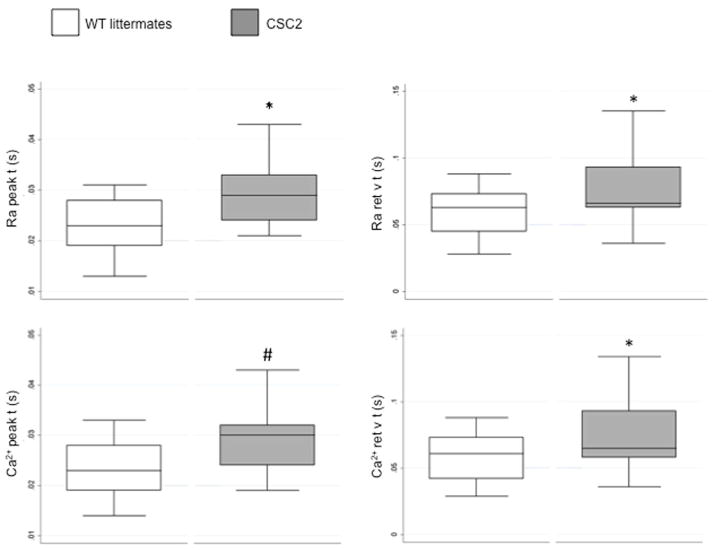
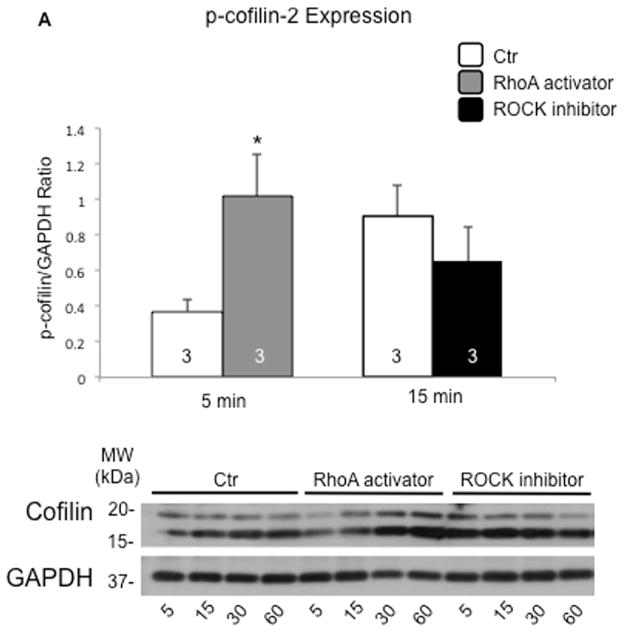
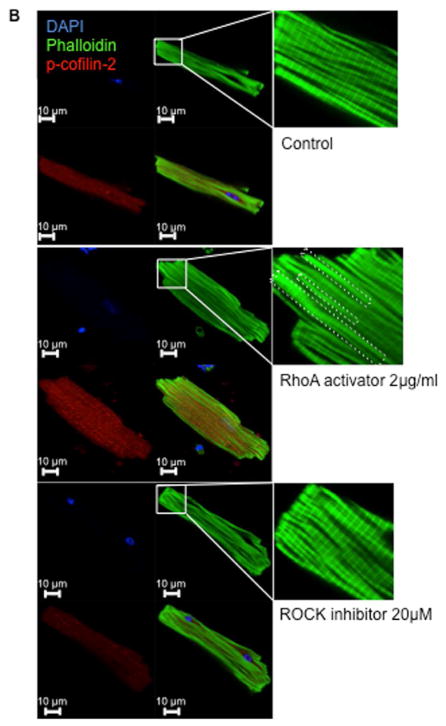
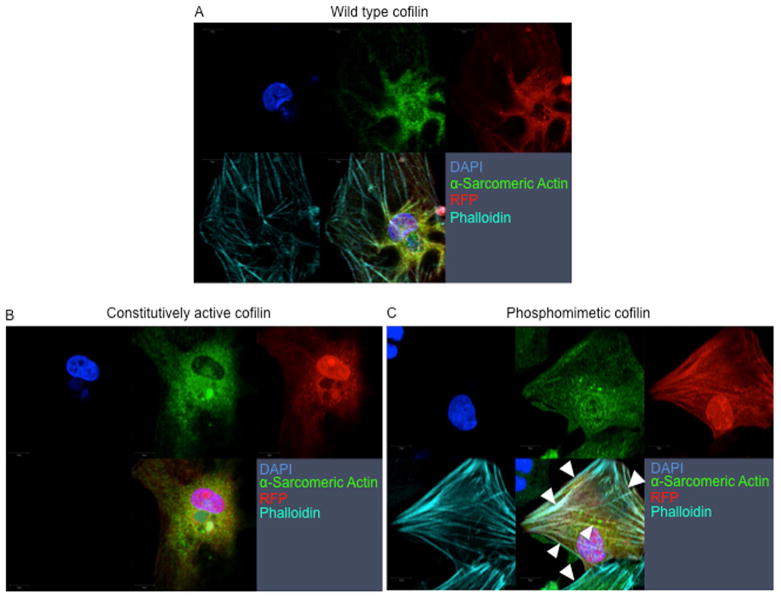
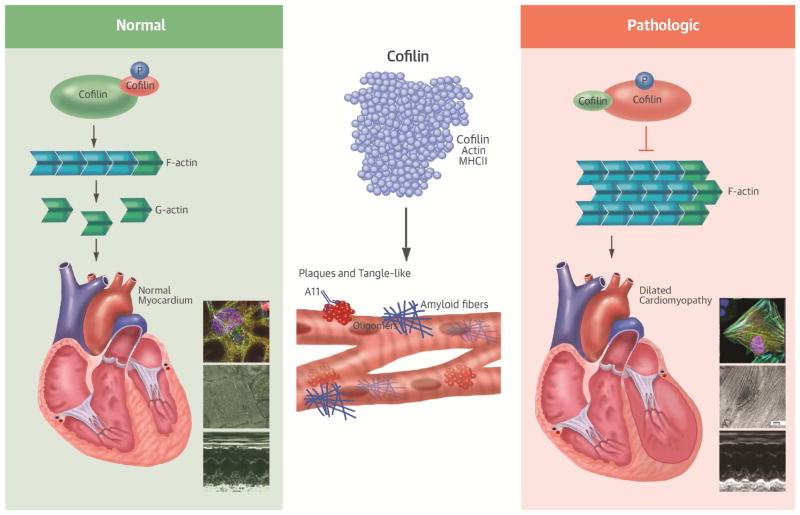
Results: Aggregates in human myocardium were enriched for cofilin-2, an actin-depolymerizing protein known to participate in neurodegenerative diseases and nemaline myopathy. Cofilin-2 was predominantly phosphorylated, rendering it inactive. Cardiac-specific haploinsufficiency of cofilin-2 in mice recapitulated the human disease's morphological, functional, and structural phenotype. Pharmacological stimulation of cofilin-2 phosphorylation and genetic overexpression of the phosphomimetic protein promoted the accumulation of "stress-like" fibers and severely impaired cardiomyocyte contractility.

Conclusions: Our study provides the first biochemical characterization of prefibrillar myocardial aggregates in humans and the first report to link cofilin-2 to cardiomyopathy. The findings suggest a common pathogenetic mechanism connecting certain iDCMs and other chronic degenerative diseases, laying the groundwork for new therapeutic strategies.

Keywords: adenovirus; heart failure; nemaline.


Figures

FIGURE 1
FIGURE 1. Cofilin-2 and Its Substrates
A11 antibody pull-down identifies cofilin-2 and its substrates within human myocardial pre-amyloid oligomers (PAO) via electron micrographs of purified PAO from (A) iDCM and (B) donor myocardium. PAOs are numerous in iDCM. (C) Proteins identified within human-extracted PAO. iDCM = idiopathic dilated cardiomyopathy. A11=structural antibodies anti-PAO
FIGURE 2
FIGURE 2. Cofilin-2 Prominence in iDCM PAO
(A) Expression of total cofilin-2 in donor (white bars) and iDCM (black bars) human hearts following extraction with Triton X-100 (left panels) or SDS detergents (right panels). Cofilin-2 quantity is increased in iDCM with SDS detergent. *p < 0.05. (B) Phospho-cofilin-2 increased significantly in iDCM by Triton-X-100 and SDS extraction. *p < 0.05, **p < 0.01. Values are mean ± SD; number of samples indicated in the bars. MW= molecular weight; kDa=kilo-Dalton. (C) Colocalization of cofilin-2 and PAO in donor and (D–E) iDCM hearts. Pixel intensity and distance overlap in iDCM but not donor hearts; the boxes define areas at higher magnification. Cofilin-2, green; A11-stained PAO, red; nuclei stained with 4′,6-diamidino-2-phenylindole (DAPI), blue. (D) iDCM sample with less A11-positive PAOs. Here, A11 stain colocalizes in the area of cofilin still within sarcomeres. (E) iDCM sample with more abundant PAO clustered in larger aggregates (more images in Online Figure 7). (F) Colocalization was quantified by Mander’s correlation coefficient (M). M1 represents the percentage of colocalization of cofilin-2 with the PAO; M2 represents colocalization of PAOs with cofilin-2; M2 Mander’s coefficient was calculated from multiple random images collected from 5 donor and 5 iDCM hearts. p = 0.000029. Values in each sample were pooled and averaged. Open symbols are individual samples; solid symbols are the mean values for donor (blue) and iDCM (orange) hearts. GAPDH = glyceraldehyde 3-phosphate dehydrogenase; SDS = sodium dodecyl sulfate; other abbreviations as in Figure 1.
FIGURE 3
FIGURE 3. Cofilin-2 Expression and Cardiac Phenotype in CSC2 Haploisufficient Mice
(A) The expression of cofilin was reduced in cardiac- specific cofilin-2 (CSC2) mice. *p < 0.05; values are mean ± SD; number of samples indicated in the bars; MW= molecular weight; kDa=kilo-Dalton. (B) Echocardiographic measurements of CSC2 mice (black bars) show a dilated LV chamber (LVEDD and LVESD), with (C) thinning of the LV wall. (D) CSC2 mice also show reduced contractile function measured as EF and FS. *p < 0.05, **p < 0.01, and ***p < 0.005 CSC2 versus WT; #p < 0.05, ##p < 0.01, and ###p < 0.005 CSC2 versus αMHC-Cre; p values are calculated using the Bonferroni method; number of mice indicated in the bars; data are mean ± SD (E) Myocardial tissue showing normal actin pattern in WT littermates and (F) in αMHC-Cre mice; (G) myocardial tissue showing actin disarray in CSC2 mice; color staining as in Figure 2. (H–L) EM images showing normal myocardial structure in WT littermates (H) and αMHC-Cre mice (I). In CSC2 mice (J, L), sarcomeric Z line disruption (arrowheads) and disorganized sarcomeres (arrows) are seen; boxed areas are shown at higher magnification: accumulation of aggregates similar to the skeletal muscle rods (insert 1), sarcomeric disarray and Z line interruption (insert 2). The mice pathology recapitulates closely structural changes observed in the myocardium of a case of human nemaline cardiomyopathy (K) (more images in Online Figure 10). AWdTh = anterior wall thickness in diastole; AWsTh = anterior wall thickness in systole; EF = ejection fraction; EM = electron microscopy; ERK = extracellular signal-regulated kinase; FS = fractional shortening; LVEDD = LV end-diastolic diameter; LVESD = LV end-systolic diameter; PWdTh = posterior wall thickness in diastole; PWsTh = posterior wall thickness in systole; WT = wild type; other abbreviations as in Figure 2.
FIGURE 4
FIGURE 4. Reduced Velocities of Rise and Decline of Ca2+ Transients in CSC2 Cardiomyocytes
Box plot of the Ca2+ transient peak and return velocity times expressed as Fura-2 340/380 ratio (Ra peak t and Ra ret v t) and nM Ca2+ (Ca2+ peak t and Ca2+ ret v t). Isolated cardiomyocytes from CSC2 show significant slower transient parameters; measurements were obtained from 31 cells from 4 WT littermate mice (open boxes), and 14 cells from 2 CSC2 mice (solid boxes). Mixed model statistical analysis was applied to allow the statistical analysis of two CSC2 mice. *p < 0.05; #p < 0.005; data are mean ± SD. Other abbreviations as in Figure 3.
FIGURE 5
FIGURE 5. Pharmacological Phosphorylation of Cofilin-2 Induces Formation of Stress-like Fibers in Cardiomyocytes
(A) Phosphorylation of cofilin-2 is increased following stimulation of RhoA (grey bars) (*p < 0.05) and reduced by ROCK inhibition (black bars) compared to control vehicle (white bars); values are mean ± SD; number of samples indicated in the bars. MW= molecular weight; kDa=kilo-Dalton. (B) RhoA stimulation and ROCK inhibition respectively stimulate and protect from “stress-like” fibers formation in adult mice cardiomyocytes compared to controls (26). Stress-like fibers are indicated by the dotted lines. Phalloidin staining of F-actin, green; phospho-cofilin, red; nuclei stained with DAPI, blue. DAPI = 4′,6-diamidino-2-phenylindole; RhoA = Ras-homolog gene family member A; ROCK = Rho-associated-protein-kinase; other abbreviations as in Figure 2.
FIGURE 6
FIGURE 6. Genetic Overexpression of Phosphomimetic Ser3-Cofilin-2 Induces Formation of Stress-like Fibers in Cardiomyocytes
(A) WT cofilin-1, (B) Ad.S3A (constitutively active), or (C) Ad.S3E (phosphomimetic) infected neonatal cardiomyocytes. Adenoviral expression of the phosphomimetic cofilin-1 increases the formation of “stress-like” fibers (arrowheads). Red-fluorescence-protein reporter gene (RFP) indicates cardiomyocytes infected with Ad.WT, Ad.S3A or Ad.S3E, red; α-Sarcomeric Actin, green; phalloidin staining of F-actin, teal; nuclei stained with DAPI, blue. Other abbreviations as in Figure 2.
Figure 7
Figure 7. Central Illustration. Cofilin in Cardiac Plaques: New Mechanisms for Dilated Cardiomyopathy
Plaques- and tangle-like aggregates accumulate in the myocardium in some cases of iDCM. The actin depolymerizing protein cofilin is enriched in the aggregates together with its binding partners actin and MHCII. Cofilin is for the most phosphorylated, thus inactivated in iDCM. The prevalent inhibition of cofilin activity in conjunction with the damage to the myofibrillar integrity and the accumulation of fibrillar aggregates interfere with the proper function of the sarcomeres ultimately contributing to cardiac dysfunction in these cases of iDCM.

Comment in

References

    1. Arbustini E, Narula N, Tavazzi L, et al. The MOGE(S) classification of cardiomyopathy for clinicians. J Am Coll Cardiol. 2014;64:304–18. - PubMed
    1. Gianni D, Li A, Tesco G, et al. Protein aggregates and novel presenilin gene variants in idiopathic dilated cardiomyopathy. Circulation. 2010;121:1216–26. - PMC - PubMed
    1. Sanbe A, Osinska H, Saffitz JE, et al. Desmin-related cardiomyopathy in transgenic mice: a cardiac amyloidosis. Proc Natl Acad Sci U S A. 2004;101:10132–6. - PMC - PubMed
    1. David DC. Aging and the aggregating proteome. Front Genet. 2012;3:247. - PMC - PubMed
    1. Naidoo N. ER and aging-Protein folding and the ER stress response. Ageing Res Rev. 2009;8:150–9. - PubMed

Publication types

MeSH terms

Supplementary concepts