. 2015:2015:893594.
doi: 10.1155/2015/893594. Epub 2015 Feb 26.

Identification of endogenous controls for analyzing serum exosomal miRNA in patients with hepatitis B or hepatocellular carcinoma

Affiliations

Identification of endogenous controls for analyzing serum exosomal miRNA in patients with hepatitis B or hepatocellular carcinoma

Yi Li et al. Dis Markers. 2015.

Abstract

Serum exosomal microRNAs (miRNAs) have received considerable attention as potential biomarkers for diagnosing cancer. The canonical technique for measuring miRNA transcript levels is reverse transcription quantitative polymerase chain reaction (RT-qPCR). One prerequisite for validating RT-qPCR data is proper normalization with respect to stably expressed endogenous reference genes. However, genes that meet all of the criteria of a control gene for exosomal miRNAs have not yet been identified. To find out the control gene for exosomal miRNAs, we evaluated the expression stability of 11 well-known reference genes in circulating exosomes. In this study, we found that the combination of miR-221, miR-191, let-7a, miR-181a, and miR-26a can be an optimal gene reference set for normalizing the expression of liver-specific miRNAs. This combination enhanced the robustness of the relative quantification analyses. These findings highlight the importance of validating reference genes before quantifying target miRNAs. Furthermore, our findings will improve studies that monitor hepatitis progression and will aid in the discovery of noninvasive biomarkers to diagnose early stage HCC.


Figures

Figure 1
Figure 1
Identification of exosomes circulating in serum. (a) Exosome size was evaluated by Transmission Electron Microscopy (TEM). The sample sources were healthy controls (A), CHB patients (B), and HCC patients (C). (b) Coomassie staining of serum-derived exosomal proteins, whole serum, and Huh-7 whole cell protein extracts (control). “M” represents a specific molecular marker ladder (Fermentas) from 130 kDa to 26 kDa. (c) Huh-7 whole cell extracts and exosomes were lysed with 1X RIPA buffer. The exosomal marker tetraspanin proteins CD63 and CD9 were analyzed by Western blot.
Figure 2
Figure 2
Expression of candidate reference genes in circulating exosomes. RT-qRCR analyses were performed on serum exosomal miRNAs. The box plot graphs of the Ct values for each reference gene illustrate the interquartile range (box) and median. The whisker plot depicts the range of the values. Circles indicate outliers. (a) All the studied samples. (b) Hepatitis B patients and age- and gender-matched healthy volunteers. (c) HCC patients and age- and gender-matched control individuals.
Figure 3
Figure 3
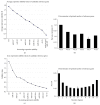
The stability of the candidate genes and the optimal number of reference genes for transcript normalization in all the samples. (a) Expression stabilities of the reference genes from the least stable (left) to the most stable (right) as analyzed by geNorm. (b) After excluding U6, miR-22 *, and miR-16 due to M > 1.5, the pairwise variations (Vn/n + 1) were analyzed for all three experimental groups. miR-221, miR-103, let-7a, miR-181c, miR-181a, and miR-26a (RG-6) were recommended as the optimal combination of reference genes. (c) The expression stability values were calculated using NormFinder. A lower stability value indicates more stable expression. (d) The gene expression Acc.S.D. was analyzed using NormFinder. The lowest Acc.S.D. value indicated that the optimal number of reference genes was 6 (RG-6).
Figure 4
Figure 4
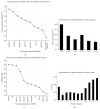
The stability of the candidate genes and the optimal number of reference genes for transcript normalization in subset 1. (a) The stabilities of the reference genes as determined by geNorm. (b) After excluding U6, miR-22 *, and miR-16 due to M > 1.5, we analyzed the pairwise variations (Vn/n + 1) using geNorm. The combination of miR-221, miR-103, let-7a, miR-181c, miR-181a, miR-191, and miR-26a (RG-7) was recommended. (c) The expression stability values were evaluated using NormFinder. (d) In NormFinder, the gene expression Acc.S.D. was analyzed. The lowest Acc.S.D. value indicated that the optimal reference gene set included miR-221 and miR-103 (RG-2).
Figure 5
Figure 5
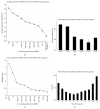
The stability of the candidate genes and the optimal number of reference genes for transcript normalization in subset 2. (a) The expression stability of each gene as analyzed by geNorm. (b) After excluding U6 and 5S due to M > 1.5, the pairwise variations (Vn/n + 1) were analyzed for subset 2. The same six miRNAs (RG-6) were recommended as the optimal combination of reference genes in subset 2. (c) The expression stability values were evaluated using NormFinder. (d) The Acc.S.D. values were analyzed using NormFinder. The lowest value indicated that the optimal number of reference genes was 5 (RG-5).
Figure 6
Figure 6
The stability of the candidate genes and the optimal number of reference genes for transcript normalization in subset 3. (a) The expression stability of each gene as analyzed by geNorm. (b) After excluding U6, miR-16, and 5S due to M > 1.5, the pairwise variations (Vn/n + 1) were analyzed for subset 3. The miR-221, miR-103, let-7a, miR-181a, miR-191, and miR-26a (RG-6d) were recommended. (c) The expression stability values were evaluated using NormFinder. (d) The Acc.S.D. values were analyzed using NormFinder. The lowest value indicated that the optimal number of reference genes was 5 (RG-5d).
Figure 7
Figure 7
Effects of different reference genes on the normalization of miR-21 expression. The expression of miR-21 was measured in serum exosomes from 18 CHB patients, 18 HCC patients, and 18 healthy subjects by RT-qPCR. The difference in miR-21 expression between groups was analyzed by t-test. # represents the probability distribution for two groups of log2-converted data that did not obey normal distribution; a nonparametric hypothesis test was used to identify their distribution. Different levels of statistical significance are denoted with asterisks (∗). “ns” represents the statistics results indicating that the two groups of log2-converted data were not significantly different.
Figure 8
Figure 8
Flowchart illustrating the approach. This figure shows the general strategy utilized to identify a pool of reference gene candidates for different groups of subjects and to determine reference gene sets using geNorm and NormFinder for real-time RT-qPCR experiments.

References

    1. Gallo A., Tandon M., Alevizos I., Illei G. G. The majority of microRNAs detectable in serum and saliva is concentrated in exosomes. PLoS ONE. 2012;7(3) doi: 10.1371/journal.pone.0030679.e30679 - DOI - PMC - PubMed
    1. Raj D. A. A., Fiume I., Capasso G., Pocsfalvi G. A multiplex quantitative proteomics strategy for protein biomarker studies in urinary exosomes. Kidney International. 2012;81(12):1263–1272. doi: 10.1038/ki.2012.25. - DOI - PubMed
    1. Caby M. P., Lankar D., Vincendeau-Scherrer C., Raposo G., Bonnerot C. Exosomal-like vesicles are present in human blood plasma. International Immunology. 2005;17(7):879–887. doi: 10.1093/intimm/dxh267. - DOI - PubMed
    1. Pols M. S., Klumperman J. Trafficking and function of the tetraspanin CD63. Experimental Cell Research. 2009;315(9):1584–1592. doi: 10.1016/j.yexcr.2008.09.020. - DOI - PubMed
    1. Murakami Y., Toyoda H., Tanahashi T., et al. Comprehensive miRNA expression analysis in peripheral blood can diagnose liver disease. PLoS ONE. 2012;7(10) doi: 10.1371/journal.pone.0048366.e48366 - DOI - PMC - PubMed

Publication types