. 2015;6(3):1944-1948.
doi: 10.1039/C4SC03388D.

A Far-Red Emitting Probe for Unambiguous Detection of Mobile Zinc in Acidic Vesicles and Deep Tissue

Affiliations

A Far-Red Emitting Probe for Unambiguous Detection of Mobile Zinc in Acidic Vesicles and Deep Tissue

Pablo Rivera-Fuentes et al. Chem Sci. 2015.

Abstract

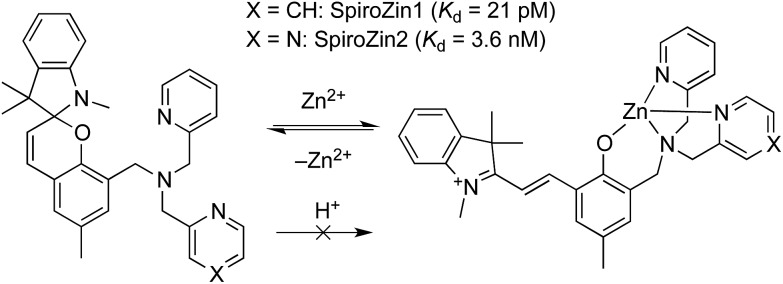
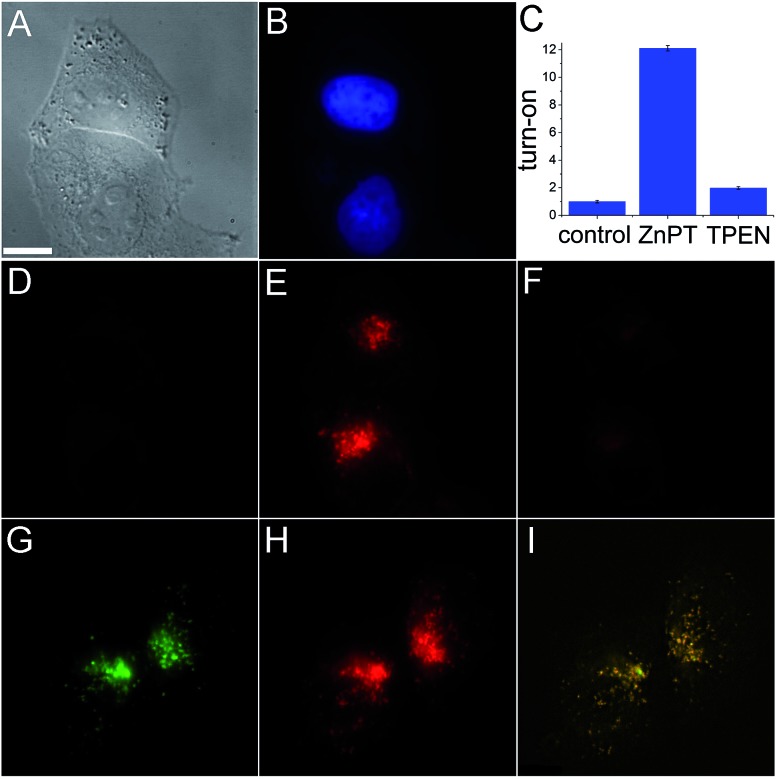
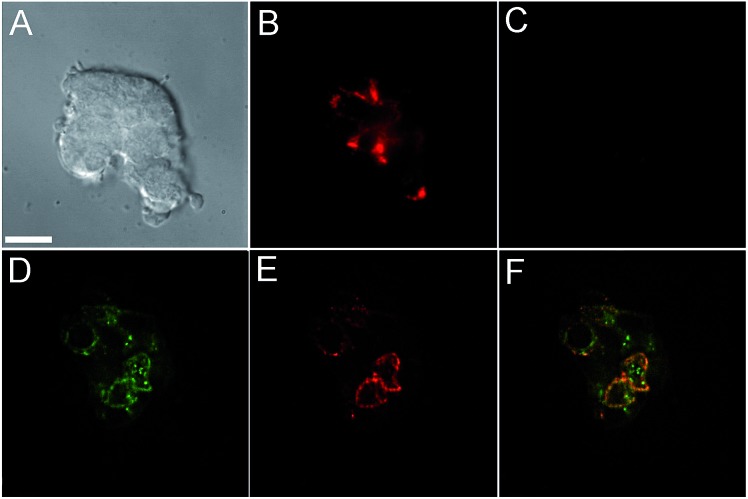
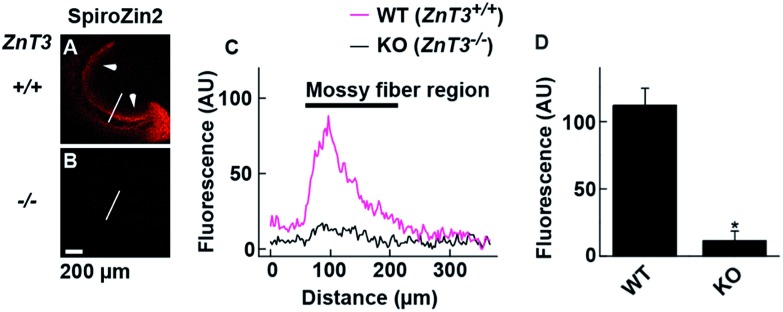
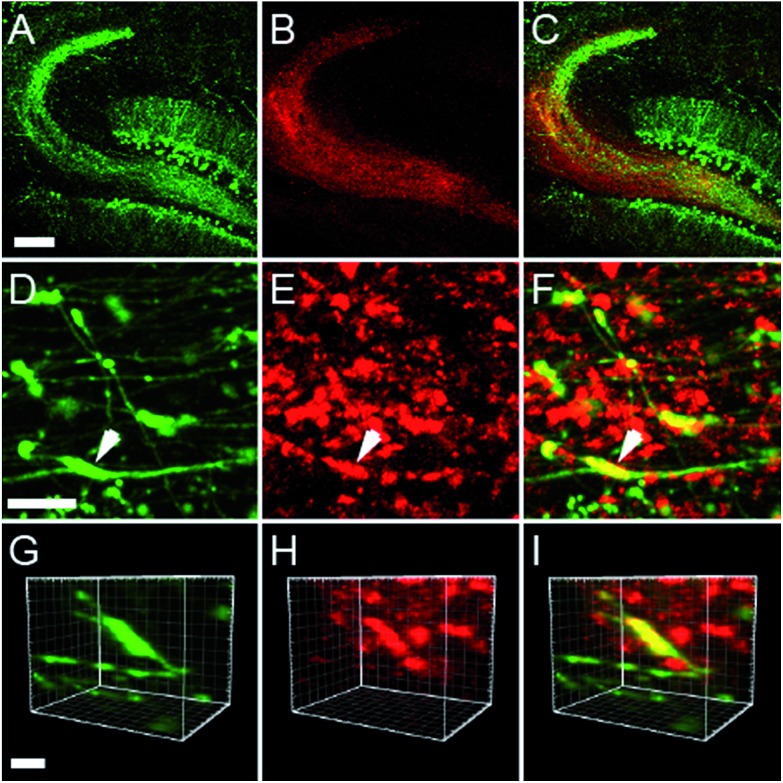
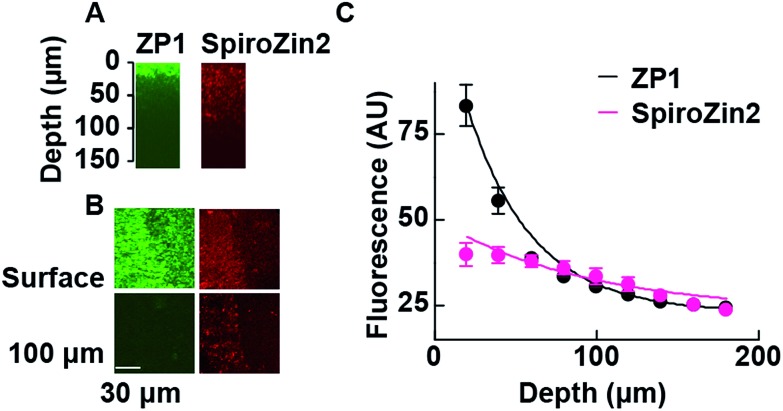
Imaging mobile zinc in acidic environments remains challenging because most small-molecule optical probes display pH-dependent fluorescence. Here we report a reaction-based sensor that detects mobile zinc unambiguously at low pH. The sensor responds reversibly and with a large dynamic range to exogenously applied Zn2+ in lysosomes of HeLa cells, endogenous Zn2+ in insulin granules of MIN6 cells, and zinc-rich mossy fiber boutons in hippocampal tissue from mice. This long-wavelength probe is compatible with the green-fluorescent protein, enabling multicolor imaging, and facilitates visualization of mossy fiber boutons at depths of >100 µm, as demonstrated by studies in live tissue employing two-photon microscopy.


Figures

Scheme 1
Scheme 1. Structure and sensing mechanism of SpiroZin probes. Replacement of a pyridine (X = CH) by a pyrazine ring (X = N) in the metal-chelating unit decreases the zinc binding affinity of the sensor, improving its dynamic range in live cells.
Scheme 2
Scheme 2. Synthesis of SpiroZin2.
Fig. 1
Fig. 1. Live HeLa cell imaging using SpiroZin2. (A) Differential interference contrast (DIC) image; (B) blue channel showing labeled nuclei; (C) quantification of the turn-on response; (D) red channel image of cells incubated with 5 μM SpiroZin2; (E) red channel 10 min after treating the cells with 30 μM ZnPT; (F) red channel 10 min after treating the cells with 50 μM TPEN; (G) green channel showing HeLa cells treated with 2 μM LTG; (H) red channel showing cells treated with 5 μM SpiroZin2 and 30 μM ZnPT; (I) overlay of deconvoluted images (G and H). Pearson's correlation coefficient: r P = 0.80(2). Images (A–F) and (G–I) correspond to two different plates. Scale bar = 10 μm. ZnPT = zinc pyrithione; LTG = LysoTracker Green®.
Fig. 2
Fig. 2. Live MIN6 cell imaging using SpiroZin2. (A) DIC image; (B) red channel showing cells treated with 5 μM SpiroZin2; (C) red channel after treating the cells with 50 μM TPEN; (D) deconvoluted green channel showing MIN6 cells treated with 2 μM LTG; (E) deconvoluted red channel showing cells treated with 5 μM SpiroZin2; (F) overlay of images (D) and (E). Pearson's correlation coefficient: r P = 0.66(4). Images (A–C) and (D–F) correspond to two different plates. Scale bar = 10 μm.
Fig. 3
Fig. 3. Visualization of vesicular zinc in hippocampal mossy fiber regions with SpiroZin2. (A and B) Representative images from adult WT ZnT3 (+/+) mice (A) and ZnT3 null (–/–) knockout (KO) mice (B). Slices were treated with 100 μM SpiroZin2. Arrows indicate the mossy fiber region in the slice. (C) SpiroZin2 fluorescence profiles across the white line on the hippocampal images in (A) and (B). (D) Quantification of SpiroZin2 fluorescence intensity in the mossy fiber region of WT ZnT3 (+/+) mice and ZnT3 null (–/–) knockout (KO) mice. WT, n = 5; KO, n = 5. *P < 0.001, unpaired t test. The peak at ∼100 μm corresponds to the mossy fiber region. The background fluorescence intensity of the lines was adjusted to 0. Scale bar = 200 μm.
Fig. 4
Fig. 4. Acute hippocampal slices of adult mice (Thy1-EGFP, line M, transgenic mouse) stained with 100 μM SpiroZin2. (A–C) Representative two-photon fluorescence images of the dentate gyrus and mossy fiber region in a hippocampal slice showing EGFP (A, green), SpiroZin2 (B, red), and the merged signal (C). Scale bar = 200 μm. (D–F) Representative fluorescence images from presynaptic boutons in the mossy fiber layer from Thy1-EGFP hippocampal slice stained with SpiroZin2. EGFP fluorescence (D, green), SpiroZin2 (E, red) and the merged image (F). Scale bar = 10 μm. (G–I) Enlarged, three-dimensional view of the colocalization of EGFP (green) and SpiroZin2 (red) in a mossy fiber bouton indicated by the arrow in D–F. Scale bar = 5 μm.
Fig. 5
Fig. 5. Two-photon fluorescence profiles of ZP1 and SpiroZin2 along the z-axis of hippocampal tissues. (A) Representative xz images of mossy fiber regions of acute hippocampal slices stained with ZP1 (green) and SpiroZin2 (red). Slices were stained with 25 μM ZP1 and 100 μM SpiroZin2 and imaged with constant laser power (860 nm, 10 mW). (B) Representative xy images of mossy fiber region (left side of the images) on the slice surface (Surface) and at a 100–110 μm depth (100 μm) stained with ZP1 (green) and SpiroZin2 (red). Scale bar = 30 μm. (C) ZP1 and SpiroZin2 fluorescence profiles across the z-axis in the hippocampal tissues. The data were fit to a single exponential curve (ZP1: τ = 40.3 μm, SpiroZin2: τ = 94.0 μm). ZP1, n = 3; SpiroZin2, n = 3.

References

    1. Solomons N. W. Ann. Nutr. Metab. 2013;62:8–17. - PubMed
    1. Takeda A., Nakamura M., Fujii H., Tamano H. Metallomics. 2013;5:417–423. - PubMed
    1. Frederickson C. J., Koh J.-Y., Bush A. I. Nat. Rev. Neurosci. 2005;6:449–462. - PubMed
    1. Li Y. V. Endocrine. 2014;45:178–189. - PubMed
    1. Frederickson C. J., Suh S. W., Silva D., Frederickson C. J., Thompson R. B. J. Nutr. 2000;130:1471S–1483S. - PubMed