

C-C chemokine receptor 2 inhibitor ameliorates hepatic steatosis by improving ER stress and inflammation in a type 2 diabetic mouse model
- PMID: 25816097
- PMCID: PMC4376739
- DOI: 10.1371/journal.pone.0120711
C-C chemokine receptor 2 inhibitor ameliorates hepatic steatosis by improving ER stress and inflammation in a type 2 diabetic mouse model
Abstract
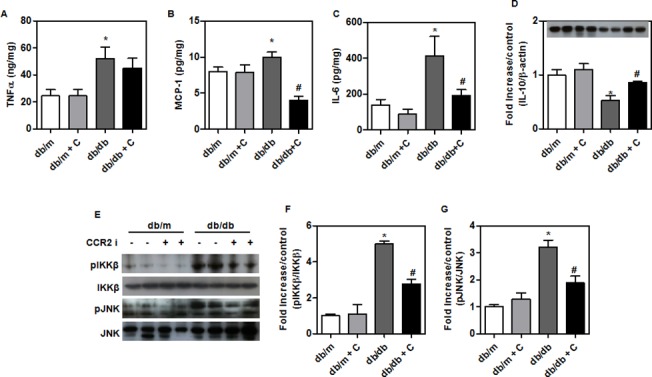
Hepatic steatosis is the accumulation of excess fat in the liver. Recently, hepatic steatosis has become more important because it occurs in the patients with obesity, type 2 diabetes, and hyperlipidemia and is associated with endoplasmic reticulum (ER) stress and insulin resistance. C-C chemokine receptor 2 (CCR2) inhibitor has been reported to improve inflammation and glucose intolerance in diabetes, but its mechanisms remained unknown in hepatic steatosis. We examined whether CCR2 inhibitor improves ER stress-induced hepatic steatosis in type 2 diabetic mice. In this study, db/db and db/m (n = 9) mice were fed CCR2 inhibitor (2 mg/kg/day) for 9 weeks. In diabetic mice, CCR2 inhibitor decreased plasma and hepatic triglycerides levels and improved insulin sensitivity. Moreover, CCR2 inhibitor treatment decreased ER stress markers (e.g., BiP, ATF4, CHOP, and XBP-1) and inflammatory cytokines (e.g., TNFα, IL-6, and MCP-1) while increasing markers of mitochondrial biogenesis (e.g., PGC-1α, Tfam, and COX1) in the liver. We suggest that CCR2 inhibitor may ameliorate hepatic steatosis by reducing ER stress and inflammation in type 2 diabetes mellitus.
Conflict of interest statement
Figures


Similar articles
-
Experimental evidence for the use of CCR2 antagonists in the treatment of type 2 diabetes.Metabolism. 2013 Nov;62(11):1623-32. doi: 10.1016/j.metabol.2013.06.008. Epub 2013 Aug 15. Metabolism. 2013. PMID: 23953944
-
Blockade of CCL2/CCR2 signalling ameliorates diabetic nephropathy in db/db mice.Nephrol Dial Transplant. 2013 Jul;28(7):1700-10. doi: 10.1093/ndt/gfs555. Epub 2013 Jun 22. Nephrol Dial Transplant. 2013. PMID: 23794669
-
Inhibition of CCR2 ameliorates insulin resistance and hepatic steatosis in db/db mice.Arterioscler Thromb Vasc Biol. 2008 Dec;28(12):2195-201. doi: 10.1161/ATVBAHA.108.168633. Epub 2008 Sep 25. Arterioscler Thromb Vasc Biol. 2008. PMID: 18818420
-
Endoplasmic reticulum proteostasis in hepatic steatosis.Nat Rev Endocrinol. 2016 Dec;12(12):710-722. doi: 10.1038/nrendo.2016.124. Epub 2016 Aug 12. Nat Rev Endocrinol. 2016. PMID: 27516341 Review.
-
Endoplasmic reticulum stress is involved in the connection between inflammation and autophagy in type 2 diabetes.Gen Comp Endocrinol. 2015 Jan 1;210:124-9. doi: 10.1016/j.ygcen.2014.09.006. Epub 2014 Sep 27. Gen Comp Endocrinol. 2015. PMID: 25260252 Review.
Cited by
-
CCR2 knockout ameliorates obesity-induced kidney injury through inhibiting oxidative stress and ER stress.PLoS One. 2019 Sep 9;14(9):e0222352. doi: 10.1371/journal.pone.0222352. eCollection 2019. PLoS One. 2019. PMID: 31498850 Free PMC article.
-
LncRNA-AK012226 Is Involved in Fat Accumulation in db/db Mice Fatty Liver and Non-alcoholic Fatty Liver Disease Cell Model.Front Pharmacol. 2018 Aug 8;9:888. doi: 10.3389/fphar.2018.00888. eCollection 2018. Front Pharmacol. 2018. PMID: 30135656 Free PMC article.
-
α-Mangostin ameliorates hepatic steatosis and insulin resistance by inhibition C-C chemokine receptor 2.PLoS One. 2017 Jun 9;12(6):e0179204. doi: 10.1371/journal.pone.0179204. eCollection 2017. PLoS One. 2017. PMID: 28598982 Free PMC article.
-
Role of MCP-1 and CCR2 in alcohol neurotoxicity.Pharmacol Res. 2019 Jan;139:360-366. doi: 10.1016/j.phrs.2018.11.030. Epub 2018 Nov 22. Pharmacol Res. 2019. PMID: 30472461 Free PMC article. Review.
-
β-aminoisobutyric acid attenuates hepatic endoplasmic reticulum stress and glucose/lipid metabolic disturbance in mice with type 2 diabetes.Sci Rep. 2016 Feb 24;6:21924. doi: 10.1038/srep21924. Sci Rep. 2016. PMID: 26907958 Free PMC article.
References
-
- Portincasa P, Grattagliano I, Palmieri VO, Palasciano G. Nonalcoholic steatohepatitis: recent advances from experimental models to clinical management. Clinical Biochemistry. 2005;38(3):203–17. - PubMed
Publication types
MeSH terms
Substances
LinkOut - more resources
Full Text Sources
Other Literature Sources
Medical
Research Materials
Miscellaneous
