. 2015 Mar 27;11(3):e1004116.
doi: 10.1371/journal.pcbi.1004116. eCollection 2015 Mar.

Behavioral modeling of human choices reveals dissociable effects of physical effort and temporal delay on reward devaluation

Affiliations

Behavioral modeling of human choices reveals dissociable effects of physical effort and temporal delay on reward devaluation

Miriam C Klein-Flügge et al. PLoS Comput Biol. .

Erratum in

Abstract

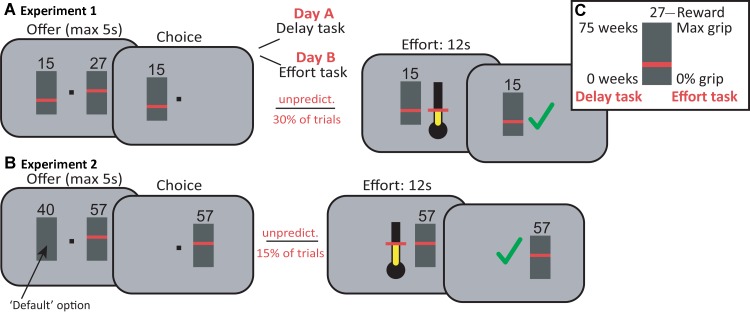
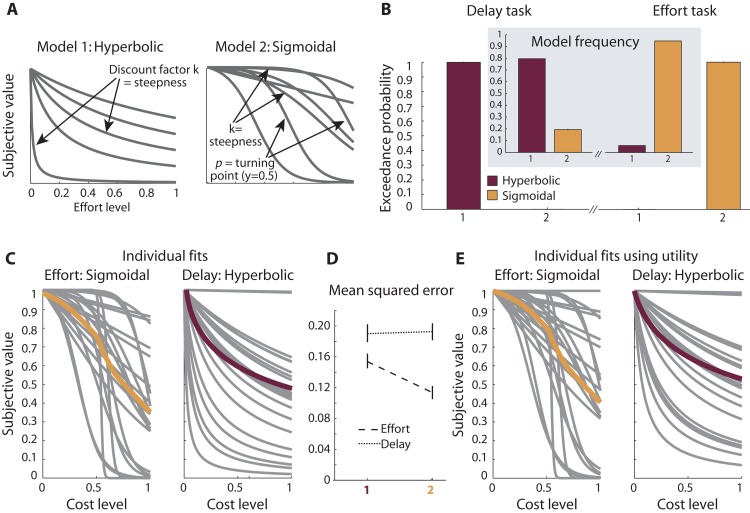
There has been considerable interest from the fields of biology, economics, psychology, and ecology about how decision costs decrease the value of rewarding outcomes. For example, formal descriptions of how reward value changes with increasing temporal delays allow for quantifying individual decision preferences, as in animal species populating different habitats, or normal and clinical human populations. Strikingly, it remains largely unclear how humans evaluate rewards when these are tied to energetic costs, despite the surge of interest in the neural basis of effort-guided decision-making and the prevalence of disorders showing a diminished willingness to exert effort (e.g., depression). One common assumption is that effort discounts reward in a similar way to delay. Here we challenge this assumption by formally comparing competing hypotheses about effort and delay discounting. We used a design specifically optimized to compare discounting behavior for both effort and delay over a wide range of decision costs (Experiment 1). We then additionally characterized the profile of effort discounting free of model assumptions (Experiment 2). Contrary to previous reports, in both experiments effort costs devalued reward in a manner opposite to delay, with small devaluations for lower efforts, and progressively larger devaluations for higher effort-levels (concave shape). Bayesian model comparison confirmed that delay-choices were best predicted by a hyperbolic model, with the largest reward devaluations occurring at shorter delays. In contrast, an altogether different relationship was observed for effort-choices, which were best described by a model of inverse sigmoidal shape that is initially concave. Our results provide a novel characterization of human effort discounting behavior and its first dissociation from delay discounting. This enables accurate modelling of cost-benefit decisions, a prerequisite for the investigation of the neural underpinnings of effort-guided choice and for understanding the deficits in clinical disorders characterized by behavioral inactivity.


Conflict of interest statement

The authors have declared that no competing interests exist.

Figures

Fig 1
Fig 1. Task: Effort and delay discounting task.
A, In Experiment 1, participants chose between a higher-reward/higher-cost (HRHC) option and a lower-reward/lower-cost option (LRLC; reward magnitude = number; cost level = height of red bar). Magnitudes and costs of both options varied from trial to trial. To directly dissociate effort and delay discounting, decision costs entailed a fixed-duration 12s power grip adjusted to individuals’ maximum grip force on one day (effort task), and a delay to reward (0–75 weeks) on the other day (delay task). Efforts were exerted on an unpredictable 30% of trials (∼15% per hand). B, In Experiment 2, participants made choices between a ‘default’ option of 40p (block1) or £2 (block2) available for no effort (left) and an alternative option of varying effort and magnitude (right). Participants’ points of subjective indifference were obtained by independently adjusting the magnitude of the alternative option for six levels of effort ([0.15 0.25 0.4 0.55 0.75 1]) across trials, using interleaved staircases. Again, decision costs entailed a 12s grip at the indicated force level. Efforts were exerted using the right hand on an unpredictable 15% of trials, thus avoiding fatigue, and feedback was given upon completion of the required force level for 12 seconds. C, The height of the red bar signaled the cost, with the top of the grey box, i.e. the maximum cost, corresponding to 75 weeks (delay task, Exp 1) or a participant’s maximum 12s-grip force. All data figures display costs according to this scale. The reward size was displayed as a number above the cost display. The information in this box was explained to the participant, but was not visible on the screen.
Fig 2
Fig 2. Force-grips: Completion of force-grip on effort trials.
Force traces from trials in which a 12s grip was exerted in Experiment 2 (A,C,E,G) and Experiment 1 (B,D,F,H). (A,B) Trial-by-trial (top) and trial-average (bottom) percentage of participants that had reached the required effort level (color bar: 0 = no participant, 1 = all participants). (C,D) Group average 12s force trace for six different effort levels, expressed as percentage of participants’ maximum voluntary contraction (MVC; Experiment 1: equally sized bins between [0,1]; Experiment 2: [0.15 0.25 0.4 0.55 0.75 1];). There was an offset at t = 0 in Experiment 1 because the 12s-effort directly followed the response which was indicated by briefly squeezing the gripper of the corresponding hand at a level of 0.35 (see Materials and Methods). (E,F) Within-trace average variability (STD = standard deviation) for the same six effort levels increases with increasing difficulty (group average ± SEM). (G,H) Required force levels are plotted against mean exerted force levels for every effort trial, showing a strong correlation in both experiments. The produced force consistently exceeded the required force level by a small amount because participants were instructed to maintain their force just above the target bar and because they kept a ‘safety margin’ to account for slight variations in force.
Fig 3
Fig 3. Experiment 1: Comparison of effort and delay discounting.
A, Two models were fitted to participants’ choice data; the hyperbolic model has previously been proposed to characterize effort and delay discounting. The sigmoidal model was included because it fulfills two particular features: it can obtain initially concave shapes, in line with work showing that the sense of effort increases as a power function of the target force with decreasing sensitivity at lower effort levels; and it entails a turning point after which effort discounting becomes progressively less steep. The equations are as follows: hyperbolic: V = M/(1+kC), sigmoidal: V = M (1- (1/(1+exp(-k*(C-p)))- 1/(1+exp(k*p))) (1 + 1/exp(k*p))). B, Bayesian model comparison of the hyperbolic and the sigmoidal model showed a clear dissociation: the hyperbolic model best explained delay-based choices (left), whereas the sigmoidal model best explained effort-based choices (right). C, Individual and average fits of the sigmoidal winning model for effort and the hyperbolic winning model for delay. D, Mean squared error, indicating the goodness of fit of the two competing models for the effort and delay task. E, Individual and average model fits, as in C, but these fits were obtained by using the utility instead of reward magnitude during parameter estimation. This has a negligible effect on the shape of discounting we observe.
Fig 4
Fig 4. Experiment 2: Model-free analysis of effort discounting.
A, Offered stimuli and choices from Experiment 2 are shown for the participants with the steepest, median and shallowest discounting, respectively, separately for the block with a default reward magnitude of 40p (left) and £2 (right). Stimuli were dynamically adjusted using a hidden staircase procedure to identify individual participant’s indifference points. For each effort level, the offered reward magnitude is displayed as the default option divided by the alternative option, thus yielding values <1 when the alternative option was associated with more reward (for alternative representations of indifference points, see panel C). Choices of the higher-reward/higher-cost option are indicated in green, choices of the effortless default option in red, and inferred multiplicative indifference points in black. B, Procedure for determining indifference points: A sigmoid function was fitted separately to the choices generated at each effort level (y axis: 0 = default option chosen, 1 = alternative option chosen), given the reward magnitude of the alternative option (x axis). The point of subjective indifference between the default and the alternative option was defined as the reward magnitude at which where the sigmoid crossed y = 0.5. Exemplary choices and fits are shown for one subject and two effort levels in the £2 (200p) block. C, Individual (coloured) and average (black) group indifference points show that effort discounting follows a concave, rather than convex, shape and scales with offer magnitude (40p vs. £2). Shown are the raw untransformed indifference magnitudes (top), a multiplicative representation of indifference points, i.e. default magnitude / indifferent magnitude (middle), and an additive representation of indifference points, i.e. (default magnitude—(indifferent magnitude—default magnitude)) (bottom). A multiplicative representation yields a percentage decrease, whereas an additive representation reflects the absolute decrease in value, which can easily lead to negative values. These data do not depend on any model fits and in all cases clearly reflect the concave nature of effort discounting, the main message of this study.

References

    1. Kahneman D, Tversky A. Prospect theory—analysis of decision under risk. Econometrica. 1979;47: 263–291.
    1. Stephens DW, Krebs JR. Foraging Theory Princeton University Press; 1986.
    1. Bateson M, Kacelnik A. Rate currencies and the foraging starling: the fallacy of the averages revisited. Behavioral Ecology. 1996;7: 341–352. 10.1093/beheco/7.3.341 - DOI
    1. Bautista LM, Tinbergen J, Kacelnik A. To walk or to fly? How birds choose among foraging modes. PNAS. 2001;98: 1089–1094. 10.1073/pnas.98.3.1089 - DOI - PMC - PubMed
    1. Stephens DW, Anderson D. The adaptive value of preference for immediacy: when shortsighted rules have farsighted consequences. Behavioral Ecology. 2001;12: 330–339. 10.1093/beheco/12.3.330 - DOI

Publication types

LinkOut - more resources