Clinical Trial
. 2015 Mar 27;10(3):e0122151.
doi: 10.1371/journal.pone.0122151. eCollection 2015.

Multi-site clinical evaluation of DW-MRI as a treatment response metric for breast cancer patients undergoing neoadjuvant chemotherapy

Affiliations
Clinical Trial

Multi-site clinical evaluation of DW-MRI as a treatment response metric for breast cancer patients undergoing neoadjuvant chemotherapy

Craig J Galbán et al. PLoS One. .

Abstract

Purpose: To evaluate diffusion weighted MRI (DW-MR) as a response metric for assessment of neoadjuvant chemotherapy (NAC) in patients with primary breast cancer using prospective multi-center trials which provided MR scans along with clinical outcome information.

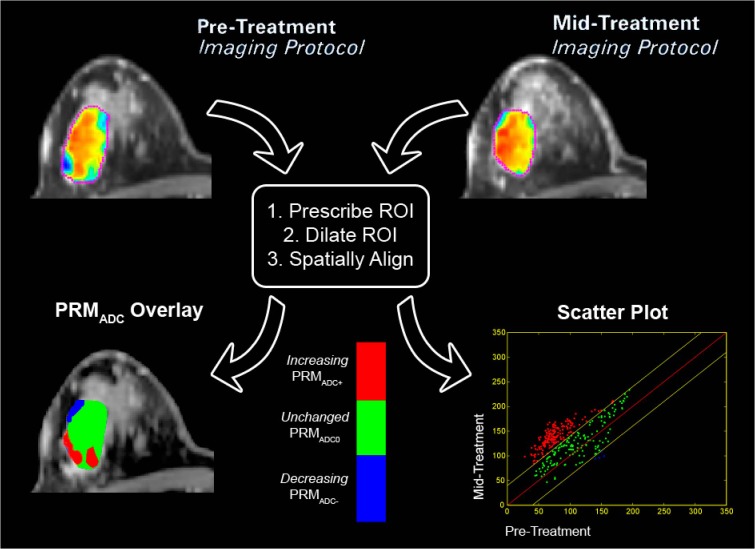
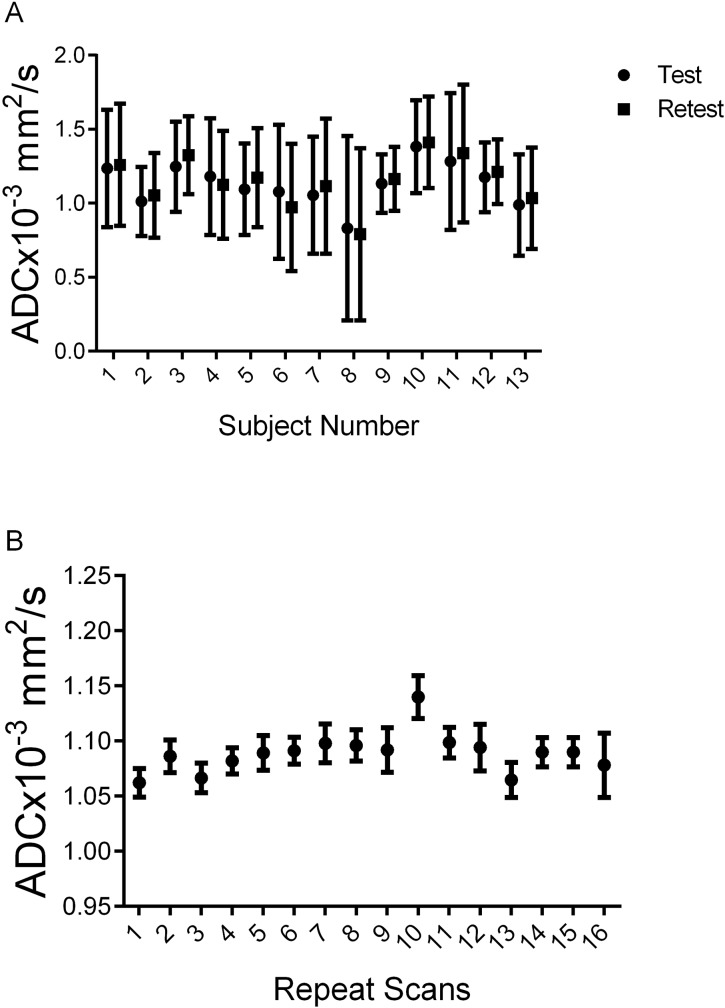
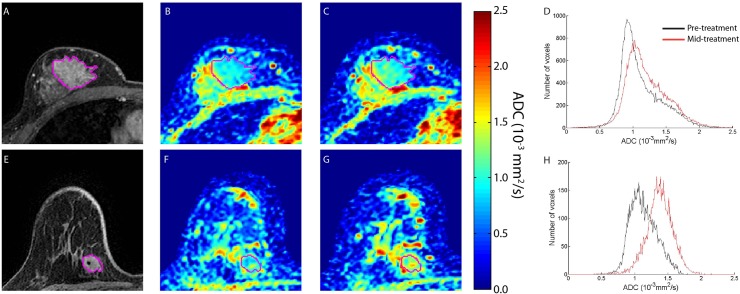
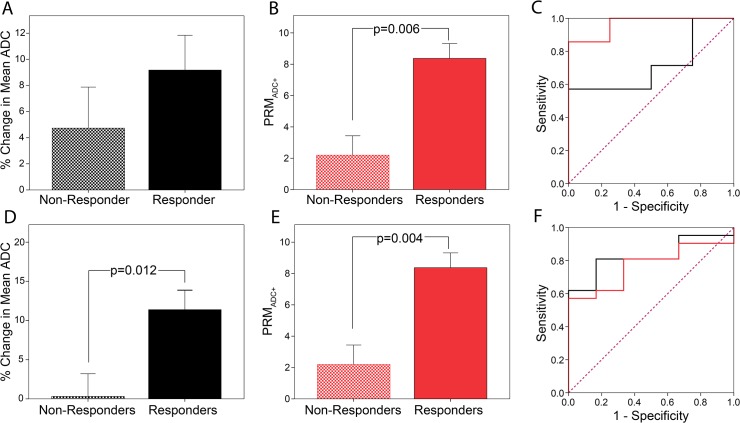
Materials and methods: A total of 39 patients with locally advanced breast cancer accrued from three different prospective clinical trials underwent DW-MR examination prior to and at 3-7 days (Hull University), 8-11 days (University of Michigan) and 35 days (NeoCOMICE) post-treatment initiation. Thirteen patients, 12 of which participated in treatment response study, from UM underwent short interval (<1hr) MRI examinations, referred to as "test-retest" for examination of repeatability. To further evaluate stability in ADC measurements, a thermally controlled diffusion phantom was used to assess repeatability of diffusion measurements. MRI sequences included contrast-enhanced T1-weighted, when appropriate, and DW images acquired at b-values of 0 and 800 s/mm2. Histogram analysis and a voxel-based analytical technique, the Parametric Response Map (PRM), were used to derive diffusion response metrics for assessment of treatment response prediction.

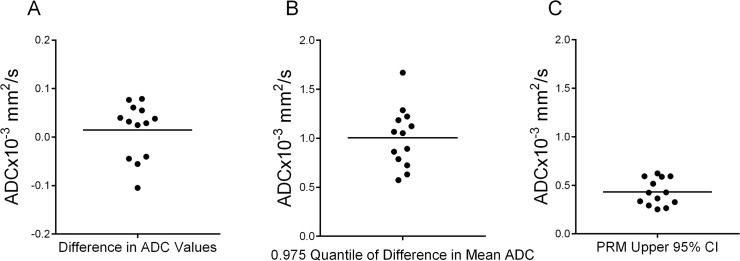
Results: Mean tumor apparent diffusion coefficient (ADC) values generated from patient test-retest examinations were found to be very reproducible (|ΔADC|<0.1x10⁻³mm2/s). This data was used to calculate the 95% CI from the linear fit of tumor voxel ADC pairs of co-registered examinations (±0.45x10⁻³mm2/s) for PRM analysis of treatment response. Receiver operating characteristic analysis identified the PRM metric to be predictive of outcome at the 8-11 (AUC = 0.964, p = 0.01) and 35 day (AUC = 0.770, p = 0.05) time points (p<.05) while whole-tumor ADC changes where significant at the later 35 day time interval (AUC = 0.825, p = 0.02).

Conclusion: This study demonstrates the feasibility of performing a prospective analysis of DW-MRI as a predictive biomarker of NAC in breast cancer patients. In addition, we provide experimental evidence supporting the use of sensitive analytical tools, such as PRM, for evaluating ADC measurements.


Conflict of interest statement

Competing Interests: The authors of this manuscript have the following competing interests. BDR, TLC, AFS, AR and CJG have the following patents (Systems and methods for tissue imaging US8768431B2 and Imaging systems, computer, program product and method for detecting changes in rates of water diffusion in a tissue using magnetic resonance imaging (MIR) US6567684B1) and disclosures to the University of Michigan related to the underlying technologies described in this report which have been licensed to Imbio, LLC, a company in which BDR and AR have a financial interest. This does not alter the authors' adherence to all PLOS ONE policies on sharing data and materials as detailed in the guide for authors.

Figures

Fig 1
Fig 1. Pictorial representation of the PRM analytical process on ADC maps.
Regions of interest (ROI) are prescribed on the pretreatment anatomical images. ROI are then dilated to encompass neighboring tissue around tumor. Control points are automatically distributed throughout the new ROI, where three-five control points must be user defined. Diffusion–weighted MRI data undergoes co-registration to pretreatment anatomical image. Registered pre and mid-treatment ADC maps are used to generate a three-color overlay representing regions in which tumor ADC values significantly increased (red voxels), significantly decreased (blue voxels) or remain unchanged (green voxels). This data can also be presented in a scatter plot and percentages assigned to the three defined ADC regions, allowing quantitative assessment of overall changes in tumor ADC values.
Fig 2
Fig 2. ADC Results from test-retest human breast and phantom studies.
Presented are summary plots of mean ADC values from (A) the test-retest of breast tumors from individual subjects accrued at the UM and (B) the repeatability analysis using a thermal-controlled diffusion phantom (i.e. ice water phantom [45,50]). Data is presented as the mean±standard deviation.
Fig 3
Fig 3. Evaluation of ADC variability in test-retest data.
Presented are scatter plots of (A) the difference in mean ADC tumor values, (B) the 0.975 quantile of the difference in mean ADC tumor values, and (C) the PRM 95% CI generated from the fit of the joint density histogram of voxels from spatially aligned serial ADC tumor maps. The 0.975 quantile of the difference in mean ADC values was determined by propagating the error (standard deviation) and calculating the 0.975 quantile as 1.96xstandard deviation. Each dot represents a single patient and the large line the mean of the entire group.
Fig 4
Fig 4. Therapeutic-induced changes in breast tumor ADC values.
MRI images are depicted for non-responding (top row) and responding (bottom row) patients treated for breast cancer. (A) and (E) T1-weighted gadolinium enhanced, (B) and (F): pre-treatment ADC maps, (C) and (G): ADC maps at 8–11 days after treatment initiation, D) and (H): Histograms of ADC values in the tumor pre-treatment and post-treatment initiation. Tumor is delineated from surrounding healthy tissue in the individual images by the purple line.
Fig 5
Fig 5. Evaluation of PRMADC as a response metric.
Parametric response maps (A) and (C) and corresponding scatter plots (B) and (D) of post- versus pre-treatment ADC values are presented for a representative non-responder (top row) and responder (bottom row). The joint density histogram from the non-responder demonstrated a negligible shift resulting in a PRMADC+, i.e., the relative tumor volume with significantly increasing ADC values, of 1.8%. In contrast, a substantial shift in the histogram was observed for the responder (PRMADC+ of 12.8%).
Fig 6
Fig 6. DW-MRI results at interval MRI examinations.
Presented are results from MRI data acquired at (A-C) UM (8–11 days) and (D-F) NeoCOMICE (35 days). The analyses include the percent change in mean ADC values and (B, E) PRM values of cancer patients diagnosed as responders and non-responders at three different interval MRI examinations as well as (C,F) ROC analysis for both readouts. Statistical significance was assessed at p<0.05. Data acquired at 8–11 days was obtained at the University of Michigan, where other interval data was acquired as part of a UK clinical trial.

References

    1. Baum M. Polychemotherapy for early breast cancer. Lancet. 1998; 352: 1554 - PubMed
    1. Saibara T, Ogawa Y, Onishi S. Tamoxifen in early breast cancer. Lancet. 1998; 352: 404 - PubMed
    1. Buzdar AU, Ibrahim NK, Francis D, Booser DJ, Thomas ES, Theriault RL, et al. Significantly higher pathologic complete remission rate after neoadjuvant therapy with trastuzumab, paclitaxel, and epirubicin chemotherapy: results of a randomized trial in human epidermal growth factor receptor 2-positive operable breast cancer. J Clin Oncol. 2005; 23: 3676–3685. - PubMed
    1. Romond EH, Perez EA, Bryant J, Suman VJ, Geyer CE Jr., Davidson NE, et al. Trastuzumab plus adjuvant chemotherapy for operable HER2-positive breast cancer. N Engl J Med. 2005; 353: 1673–1684. - PubMed
    1. Valero V, Buzdar AU, McNeese M, Singletary E, Hortobagyi GN. Primary chemotherapy in the treatment of breast cancer: the University of Texas M. D. Anderson Cancer Center experience. Clin Breast Cancer. 2002; 3 Suppl 2: 63–68. - PubMed

Publication types