. 2015 Apr 8;17(4):429-40.
doi: 10.1016/j.chom.2015.03.001. Epub 2015 Mar 26.

Autophagy mediates tolerance to Staphylococcus aureus alpha-toxin

Affiliations

Autophagy mediates tolerance to Staphylococcus aureus alpha-toxin

Katie Maurer et al. Cell Host Microbe. .

Abstract

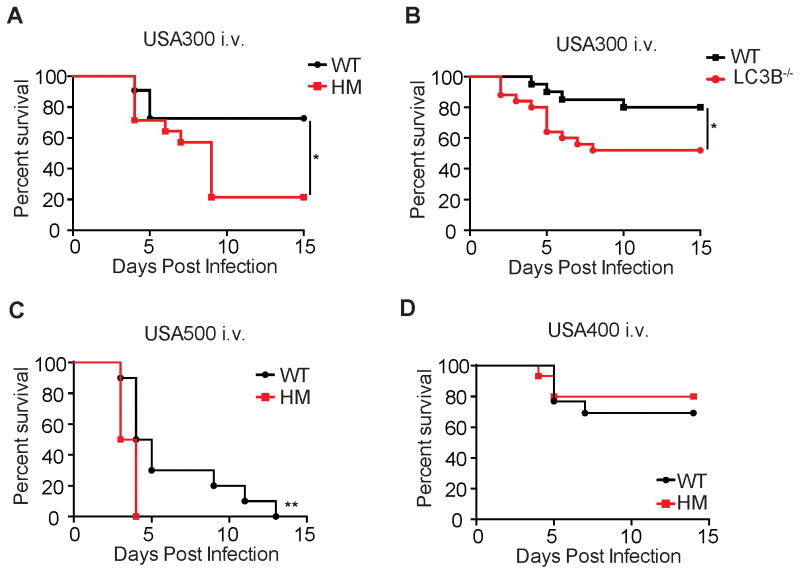
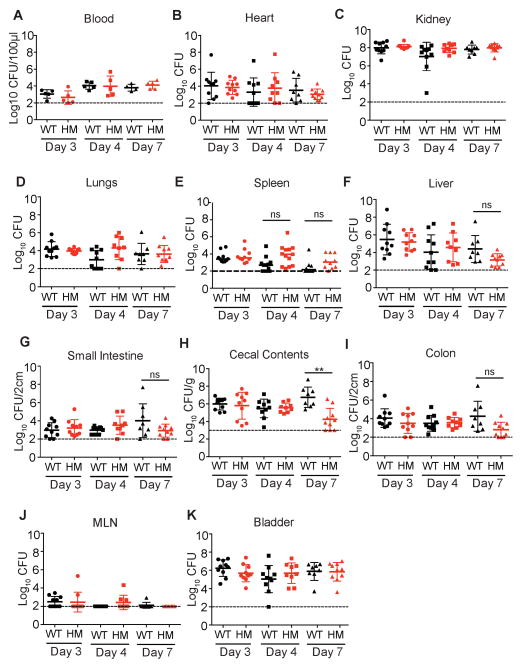
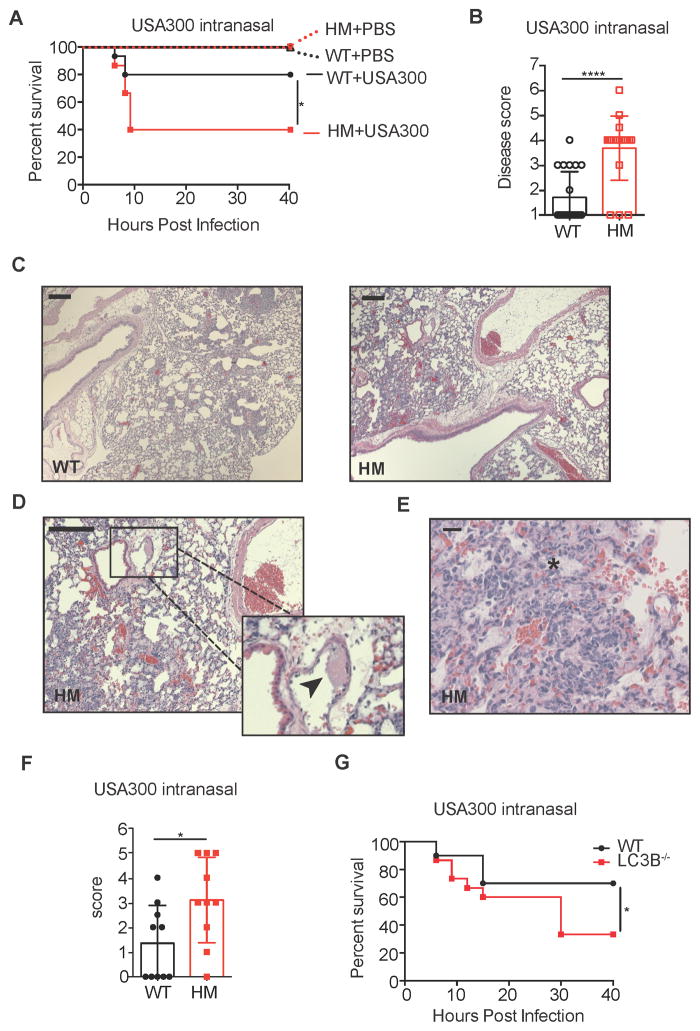
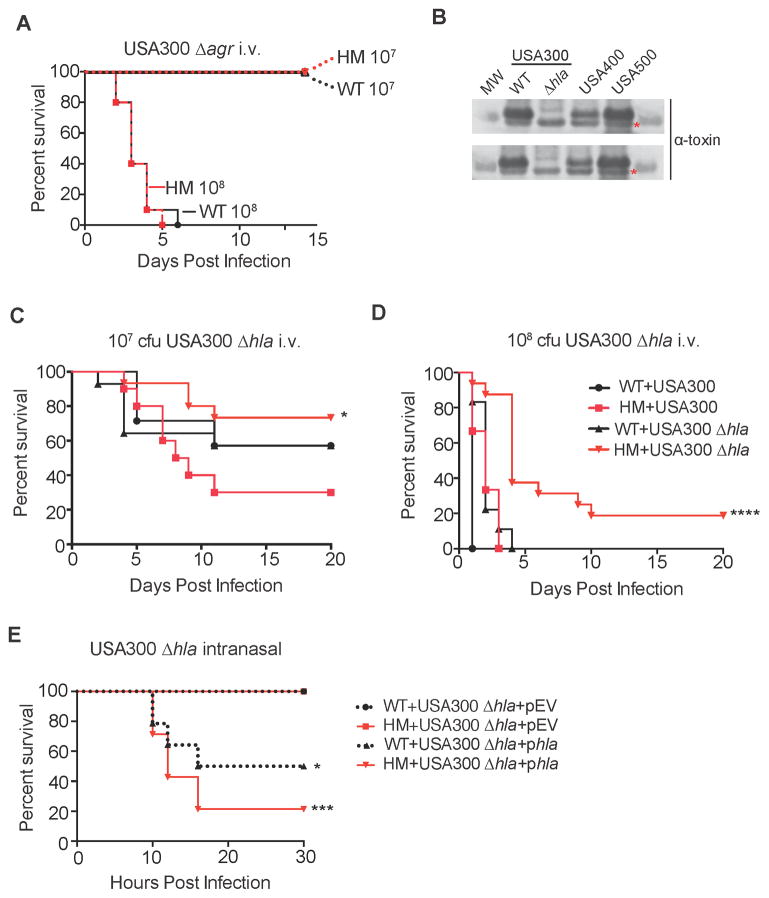
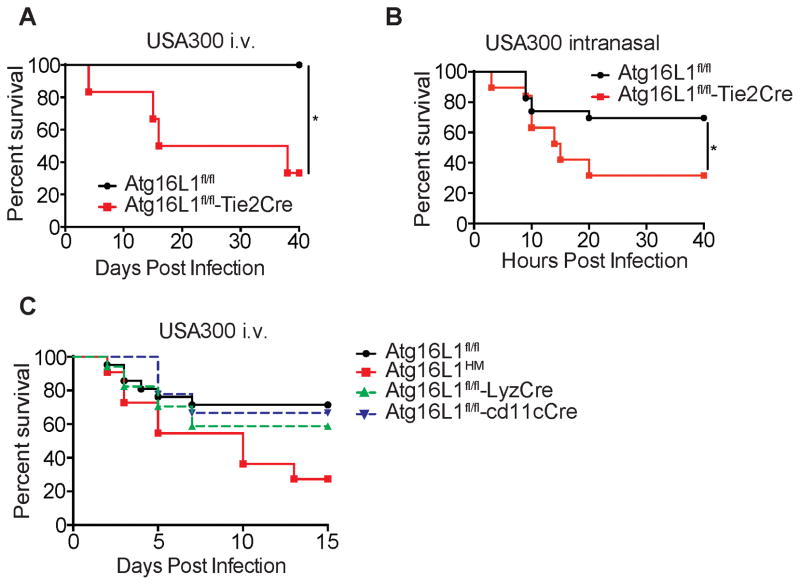
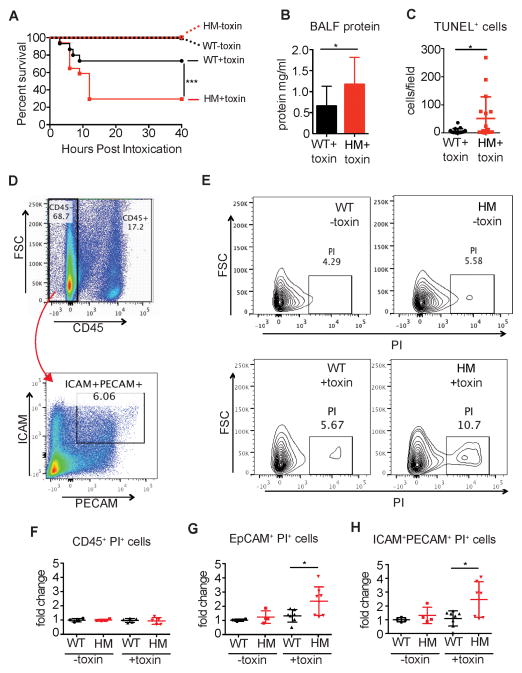
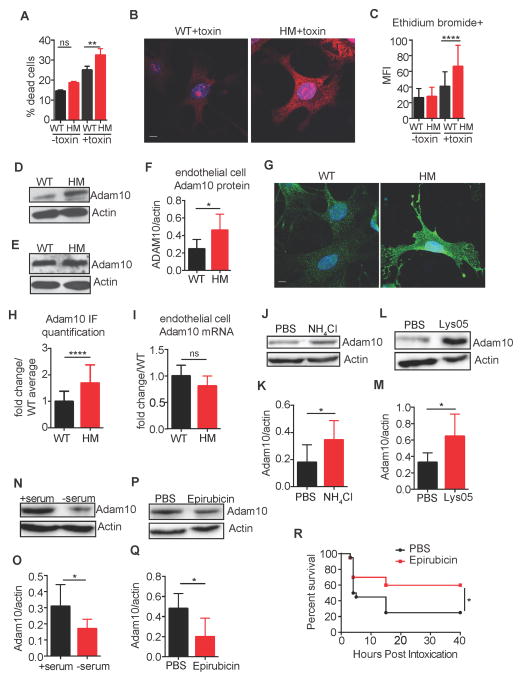
Resistance and tolerance are two defense strategies employed by the host against microbial threats. Autophagy-mediated degradation of bacteria has been extensively described as a major resistance mechanism. Here we find that the dominant function of autophagy proteins during infections with the epidemic community-associated methicillin-resistant Staphylococcus aureus USA300 is to mediate tolerance rather than resistance. Atg16L1 hypomorphic mice (Atg16L1(HM)), which have reduced autophagy, were highly susceptible to lethality in both sepsis and pneumonia models of USA300 infection. Autophagy confers protection by limiting the damage caused by α-toxin, particularly to endothelial cells. Remarkably, Atg16L1(HM) mice display enhanced survival rather than susceptibility upon infection with α-toxin-deficient S. aureus. These results identify an essential role for autophagy in tolerance to Staphylococcal disease and highlight how a single virulence factor encoded by a pathogen can determine whether a given host factor promotes tolerance or resistance.


Conflict of interest statement

COMPETEING FINANTIAL INTERESTS

The authors declare no competing financial interests.

Figures

Figure 1
Figure 1. Autophagy Deficiency Results in Susceptibility to Systemic S. aureus Infection in a Strain-Specific Manner
(A) Survival curve of wild-type control (WT) and Atg16L1 hypomorph (HM) mice infected i.v. with 107 colony forming units (cfu) USA300. n=12–14 mice/group. (B) Survival curve of WT and LC3B−/− mice infected with 107 cfu USA300. n=20–25 mice/group. (C) Survival curve of WT and Atg16L1HM mice infected with 107 cfu USA500. n=10 mice/group. (D) Survival curve of WT and Atg16L1HM mice infected with 107 cfu USA400. n=15 mice/group. Data represent at least 2 independent repeats. *p<0.05, **p<0.01
Figure 2
Figure 2. WT and Atg16L1HM mice display similar bacterial burden during S. aureus infection
(A–K) Bacterial burden was quantified in the indicated organs and blood harvested from WT and Atg16L1HM mice injected i.v. with 107 cfu USA300 on days 3, 4, and 7 post infection. Data points represent bacterial burden in individual mice, bars represent median, and dashed line represents limit of detection. n=8–13 mice/condition. No significant differences in bacterial burden were noted when comparing the same organ from WT and Atg16L1HM mice except when comparing cecal contents on day 7 (H). Statistical analyses were performed by ANOVA with the Kruskal-Wallis test and Dunn’s correction. Each time point represents data pooled from 2–3 independent repeats.
Figure 3
Figure 3. Autophagy Mediates Susceptibility to S. aureus Lung Infection
(A) Survival curve of WT and Atg16L1HM mice inoculated intranasally with 4x10⁸ cfu USA300 or equivalent volume of PBS. n=15 mice/group for USA300 and n=5 mice/group for PBS. (B) Disease score of WT and Atg16L1HM mice 6 hours post intranasal inoculation with 4x10⁸ cfu USA300. Disease score was calculated using a 7-point activity assessment score based on mobility, food and water intake, posture, and fur ruffling (see supplemental methods). n=10 mice/group. Data represent mean and SEM. (C) Representative H&E-stained sections of lungs from WT and Atg16L1HM mice 6 hr post intranasal inoculation with 4x10⁸ cfu USA300. scale bar = 200 μm. (D–E) Higher magnification images showing features only present in the lungs from Atg16L1HM mice. Black arrow head in (D) indicates fibrin thrombus and asterisk in (E) indicates edema. scale bar = 200 μm (D) or 20 μm (E). (F) Blind quantification of pathology observed in lungs from WT and Atg16L1HM mice. Score was calculated using a 5-point score based on tissue destruction, hemorrhage, and visible cocci (see supplemental methods). n=10 mice/group. Data represent mean and SEM. (G) Survival curve of WT and LC3B−/− mice inoculated intranasally with 4x10⁸ cfu USA300. n=15–20 mice/group. Data represent at least 2 independent experiments. *p<0.05, ****p<0.0001
Figure 4
Figure 4. Susceptibility to S. aureus Conferred by Autophagy Deficiency Is Dependent on Bacterial α-toxin Production
(A) WT and Atg16L1HM mice were injected i.v. with 107 or 108 cfu USA300 Δagr. n=10 mice/group. Data represent 2 independent experiments. (B) Western blot analysis of USA300, USA300 Δhla, USA400, and USA500 using an anti-α-toxin antibody. MW indicates molecular weight protein marker, WT indicates isogenic wild type USA300, asterisk indicates a non-specific, anti-α-toxin cross-reactive band. (C) WT and Atg16L1HM mice were infected i.v. with 107 cfu USA300 or USA300 Δhla. n=7–15 mice/group. Data represent 2 independent experiments. *p<0.05 comparing Atg16L1HM + USA300 versus Atg16L1HM + USA300 Δhla. (D) WT and Atg16L1HM mice were infected i.v. with 108 cfu USA300 or USA300 Δhla. n=7–15 mice/group. Data represent 4 independent experiments. ****p<0.0001 comparing Atg16L1HM + USA300 versus Atg16L1HM + USA300 Δhla and ****p<0.0001 comparing Atg16L1HM + USA300 Δhla versus WT + USA300 Δhla. (E) WT and Atg16L1HM mice were inoculated intranasally with 108 cfu USA300 Δhla transformed with either empty plasmid (USA300 Δhla+EV) or a plasmid overexpressing hla (USA300 Δhla+phla). n=8–14 mice/group. Data represent 3 independent experiments. *p<0.05 comparing WT + USA300 Δhla+EV with WT + USA300 Δhla+phla. ***p<0.001 comparing Atg16L1HM + USA300 Δhla+EV with Atg16L1HM + USA300 Δhla+phla.
Figure 5
Figure 5. Atg16L1 Deletion in Endothelial Cells Confers Susceptibility to S. aureus Mediated Lethality
(A) Survival curve of Atg16L1fl/fl (controls) and Atg16L1fl/fl-Tie2Cre mice infected i.v. with 107 cfu USA300. n=5–6 mice/group. (B) Survival curve of Atg16L1fl/fl and Atg16L1fl/fl-Tie2Cre mice inoculated intranasally with 4x10⁸ cfu USA300. n=24 mice for Atg16L1fl/fl and n=15 mice for Atg16L1fl/fl -Tie2Cre. (C) Survival curve of Atg16L1HM, Atg16L1fl/fl, Atg16L1fl/fl-LyzCre, and Atg16L1fl/fl-CD11cCre mice infected i.v. with 107 cfu USA300. n=10 mice for Atg16L1HM, n=21 mice for Atg16L1fl/fl, n=18 mice for Atg16L1fl/fl-LyzCre, n=9 mice for Atg16L1fl/fl-CD11cCre. Data represent at least 2 independent experiments. *p<0.05
Figure 6
Figure 6. Intranasal α-toxin Treatment Is Sufficient to Induce Increased Lethality in Atg16L1-Deficient Mice
(A) Survival curve of WT and Atg16L1HM mice inoculated intranasally with a 20μl suspension of filter-sterilized S. aureus culture supernatant containing α-toxin (+toxin) or lacking α-toxin (toxin). Supernatant were prepared from the exotoxin-deficient Newman Δhla/hlg/lukAB/lukED/pvl& strain +/− α-toxin overexpression. n=15–17 mice/group. (B) Protein content of bronchoalveolar lavage fluid of WT and Atg16L1HM mice 3 hours post-intranasal inoculation with α-toxin as in (A). n=12–13 mice/group. Data points represent mean and SEM. (C) Quantification of TUNEL+ cells per field of WT and Atg16L1HM mice 3 hours post-intranasal inoculation with α-toxin as in (A). n=3 mice/group. Data points represent mean and SEM. (D–H) Flow cytometry analysis of single cell lung homogenates from WT and Atg16L1HM mice 3 hours post-intranasal inoculation with α-toxin. (D) Plots showing gating strategy to identify ICAM+PE-CAM+ cells within the CD45 fraction. Representative WT mouse shown. (E) Representative plots of PI+ cells gated on the CD45ICAM+PE-CAM+ fraction as in (D) from lungs harvested from mice treated with α-toxin (bottom panels) or control suspension (top panels). Samples harvested from WT and Atg16L1HM mice are represented in the left and right panels, respectively. (F–H) Quantification of the proportion of (F) CD45+, (G) CD45EpCam+, and (H) CD45ICAM+PE-CAM+ cells that are PI+ 3 hours post-intranasal inoculation with α-toxin or control suspension. Values are expressed as fold-change over WT mice treated with control suspension. n=4–7 mice/group Individual points in (B), (C), (F), (G), and (H) represent cells from individual animals and bar graphs in (B) represent mean and SEM from at least two independent experiments. *p<0.05, **p<0.01, ***p<0.001
Figure 7
Figure 7. Autophagy-Deficient Endothelial Cells Are More Susceptible to α-toxin in vitro.
(A) Percent cell death measured by the lactate dehydrogenase (LDH) assay in cultured endothelial cells harvested from WT and Atg16L1HM mice inoculated with α-toxin or control suspension. Data represents 5 independent experiments, each using cells pooled from 2 WT or Atg16L1HM mice. Data represent mean and SEM. (B) Representative images of ethidium bromide incorporation by endothelial cells from WT and Atg16L1HM mice inoculated with α-toxin as an assay for pore formation. Scale bar=10μm. (C) Quantification of mean fluorescent intensity (MFI) per cell from (B). n=44 cells from 3 WT mice and 83 cells from 3 Atg16L1HM mice. Data represent mean and SEM. (D–F) Representative Western blots for Adam10 and actin in whole cell lysates prepared from endothelial cells (D) and bone marrow cells (E) harvested from WT and Atg16L1HM mice. Quantification of Adam10 levels normalized to actin in endothelial cells shown in (F). n=5–6 mice/group. Data represent mean and SEM. (G) Representative immuno-fluorescence staining of Adam10 in endothelial cells from WT and Atg16L1HM mice. Scale bar=10μm. (H) Quantification of mean fluorescent intensity (MFI) per cell from (E). n=63 cells from 3 WT mice and 137 cells from 3 Atg16L1HM mice. Data represent mean and SEM. (I) Adam10 mRNA expression in endothelial cells from WT and Atg16L1HM mice normalized to GAPDH. n=5 mice/group. (J–K) Representative Western blot (J) and quantification (K) for Adam10 and actin in whole cell lysates from WT endothelial cells treated with PBS or 20mM ammonium chloride (NH4Cl) for 24 hours. n=7 replicates/group from 2 independent experiments (see supplemental methods for full experimental design). (L–M) Representative Western blot (L) and quantification (M) for Adam10 and actin in whole cell lysates from WT endothelial cells treated with PBS 5μM Lys05 for 24 hours. n=6–9 replicates/group from 2 independent experiments. (N–O) Representative Western blot (N) and quantification (O) for Adam10 and actin in whole cell lysates from WT endothelial cells treated with complete media (+serum) or media without serum (− serum) for 6 hours to induce autophagy. n=6–7 replicates/group from 2 independent experiments. (P–Q) Representative Western blot (P) and quantification (Q) for Adam10 and actin in whole cell lysates from WT endothelial cells treated with PBS or 100μM epirubicin for 6 hours. n=4–5 replicates/group from 2 independent experiments. (R) Survival curve of curve of WT mice treated i.p. with epirubicin (0.6μg/g body weight) or PBS vehicle control and inoculated intranasally with a 20μl suspension of filter-sterilized S. aureus culture supernatant containing α-toxin (+toxin). n=19–20 from 4 independent experiments. *p<0.05, **p<0.01, ****p<0.0001

Comment in

Similar articles

Cited by

References

    1. Alonzo F, 3rd, Torres VJ. The bicomponent pore-forming leucocidins of Staphylococcus aureus. Microbiology and molecular biology reviews : MMBR. 2014;78:199–230. - PMC - PubMed
    1. Ayres JS, Trinidad NJ, Vance RE. Lethal inflammasome activation by a multidrug-resistant pathobiont upon antibiotic disruption of the microbiota. Nature medicine. 2012;18:799–806. - PMC - PubMed
    1. Becker RE, Berube BJ, Sampedro GR, DeDent AC, Bubeck Wardenburg J. Tissue-Specific Patterning of Host Innate Immune Responses by Staphylococcus aureus alpha-Toxin. Journal of innate immunity. 2014;6:619–631. - PMC - PubMed
    1. Berube BJ, Bubeck Wardenburg J. Staphylococcus aureus alpha-toxin: nearly a century of intrigue. Toxins. 2013;5:1140–1166. - PMC - PubMed
    1. Bessede A, Gargaro M, Pallotta MT, Matino D, Servillo G, Brunacci C, Bicciato S, Mazza EM, Macchiarulo A, Vacca C, et al. Aryl hydrocarbon receptor control of a disease tolerance defence pathway. Nature. 2014;511:184–190. - PMC - PubMed

Publication types