. 2015 Jun:41:147-64.
doi: 10.1016/j.humov.2015.02.010. Epub 2015 Mar 25.

Visual contribution to human standing balance during support surface tilts

Affiliations

Visual contribution to human standing balance during support surface tilts

Lorenz Assländer et al. Hum Mov Sci. 2015 Jun.

Abstract

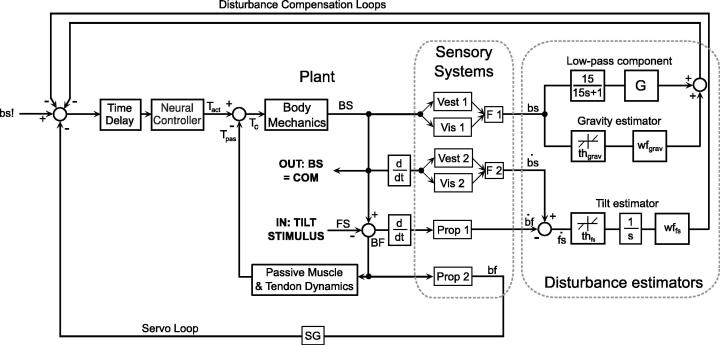
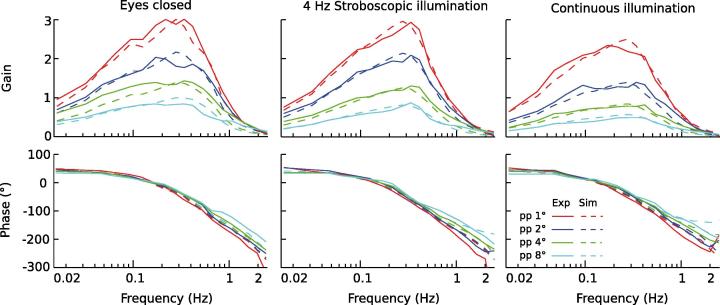
Visual position and velocity cues improve human standing balance, reducing sway responses to external disturbances and sway variability. Previous work suggested that human balancing is based on sensory estimates of external disturbances and their compensation using feedback mechanisms (Disturbance Estimation and Compensation, DEC model). This study investigates the visual effects on sway responses to pseudo-random support surface tilts, assuming that improvements result from lowering the velocity threshold in a tilt estimate and the position threshold in an estimate of the gravity disturbance. Center of mass (COM) sway was measured with four different tilt amplitudes, separating the effect of visual cues across the conditions 'Eyes closed' (no visual cues), '4Hz stroboscopic illumination' (visual position cues), and 'continuous illumination' (visual position and velocity cues). In a model based approach, parameters of disturbance estimators were identified. The model reproduced experimental results and showed a specific reduction of the position and velocity threshold when adding visual position and velocity cues, respectively. Sway variability was analyzed to explore a hypothesized relation between estimator thresholds and internal noise. Results suggest that adding the visual cues reduces the contribution of vestibular noise, thereby reducing sway variability and allowing for lower thresholds, which improves the disturbance compensation.

Keywords: Human posture control; Model simulations; Noise; Sensory and Motor Testing; Stroboscopic illumination; Visual cues.


Figures

Fig. 1
Fig. 1
DEC posture control model for the simulation of support surface tilt stimuli. Fixed control parameters and parameter values obtained from the optimization procedure are given in Table 1. The model has three neural feedback loops based on sensory signals, which are the reflexive part of the Servo Loop (via box Prop 2) and two Disturbance Compensation Loops. The three loops feed via the summing junction into the neural controller with a time delay. The neural controller and a fourth loop, representing the Passive Muscle and Tendon Dynamics provide the torque that is driving the Body Mechanics, which include the inertia of a single inverted pendulum and gravitational forces. The kinematics of the Body-in-Space angular displacement (BS) are sensed by visual, vestibular and proprioceptive systems, which each provide position and velocity information. BS is also used as the measured output (OUT: BS = COM) for comparison with the human COM sway. The sensory information of visual and vestibular cues is assumed to be fused (boxes F1 and F2) and to provide sensory estimates of BS and its velocity (internal signals, lower case letters). The tilt stimulus represents the input for the support surface tilt sequence that was used in the experiments. Subtracting the tilt signal (which is equal to the Foot-in-Space signal FS) from the BS signal provides the physical variables of body orientation with respect to the foot (BF) and its derivative, both of which are sensed by the proprioceptive system providing the sensory signals bf (box Prop 1) and its derivative (Prop 2). In subsequent processing steps, the sensory information is fused to obtain sensory estimates of the external disturbances acting on the body (disturbance estimators).
Fig. 2
Fig. 2
Tilt stimulus sequence, its spectral characteristics, and the three visual conditions used in the experiments. Shown are the time courses (A), the visual conditions (B), the position spectra (C) and the velocity spectra (D) for the four peak-to-peak stimulus amplitudes pp 1°, pp 2°, pp 4° and pp 8° (color coding). ‘Low’, ‘Mid’, and ‘High’ indicate the frequency ranges which were used in the analyses.
Fig. 3
Fig. 3
Stimulus evoked sway. (A) Stimulus evoked sway in the time domain for the three visual conditions (columns) and the four stimulus amplitudes (color coding); averages across 7 subjects and 10 cycles per subject. (B) Characterization of the stimulus evoked sway in terms of Bode histograms (gain and phase) and coherence functions across frequency. Gain gives the amplitude ratio between sway response amplitudes and tilt stimulus amplitudes. For a gain of one, the sway response amplitude equals the stimulus sway at the given frequency. A gain of zero indicates that the stimulus does not evoke any sway. Phase is a measure of the temporal relation between tilt stimulus and sway response. The body sway is in phase with the platform stimulus at 0° and is in counter phase at +/− 180°. Coherence is a measure of the signal to noise ratio of the stimulus evoked sway. (C) Averages of gain values (shown in B) across the Low, Mid, and High frequency ranges (columns) displayed for the peak-to-peak tilt stimulus amplitudes (abscissa) and for the three visual conditions. (For interpretation of the references to color in this figure legend, the reader is referred to the web version of this article.)
Fig. 4
Fig. 4
COM sway separated into one component that is not correlated to the tilt stimulus (A; sway variability) and one component correlated to the tilt stimulus (B; stimulus evoked sway). COM sway for the three visual conditions is plotted over peak-to-peak tilt stimulus amplitude (abscissa), separately for the Low, Mid, and High frequency ranges. Top rows show the averaged sway, bottom rows the sway normalized to the eyes closed condition to highlight the effect of the visual conditions. (C and D) Results of the bootstrap hypothesis tests comparing sway parameters across visual conditions. SI < EC shows the results of the hypothesis test that sway variability (panel C) or stimulus evoked sway (panel D) is smaller during stroboscopic illumination as compared to Eyes closed. CI < SI show the hypothesis test results that the sway components are smaller in continuous illumination as compared to stroboscopic illumination. The hypothesis tests were performed individually for each stimulus amplitude (abscissa) and for the Low, Mid, and High frequency ranges.
Fig. 5
Fig. 5
Simulation responses (dashed lines) and experimental responses (solid lines; equal to Fig. 3) of the COM to tilt stimulus FRF for the three visual conditions (columns) in terms of gain (top row) and phase (bottom row) over tilt frequency. Each plot gives the stimulus evoked sway results for the four tilt stimulus amplitudes. The simulation results were obtained using the model shown in Fig. 1 and the corresponding set of parameters for each of the three visual conditions (Table 1).

References

    1. Amblard B., Crémieux J., Marchand A.R., Carblanc A. Lateral orientation and stabilization of human stance: static versus dynamic visual cues. Experimental Brain Research. 1985;61(1):21–37. - PubMed
    1. Assländer L., Hettich G., Gollhofer A., Mergner T. Contribution of visual velocity and displacement cues to human balancing of support surface tilt. Experimental Brain Research. 2013;228(3):297–304. - PubMed
    1. Bach M., Kommerell G. Determining visual acuity using European normal values: scientific principles and possibilities for automatic measurement. Klinische Monatsblätter Für Augenheilkunde. 1998;212(4):190–195. - PubMed
    1. Blümle A., Maurer C., Schweigart G., Mergner T. A cognitive intersensory interaction mechanism in human postural control. Experimental Brain Research. 2006;173(3):357–363. - PubMed
    1. Bosco G., Poppele R.E. Representation of multiple kinematic parameters of the cat hindlimb in spinocerebellar activity. Journal of Neurophysiology. 1997;78(3):1421–1432. - PubMed

Publication types