. 2015 Apr 7;21(4):558-70.
doi: 10.1016/j.cmet.2015.02.017. Epub 2015 Mar 26.

Pharmacological inhibition of PI3K reduces adiposity and metabolic syndrome in obese mice and rhesus monkeys

Affiliations

Pharmacological inhibition of PI3K reduces adiposity and metabolic syndrome in obese mice and rhesus monkeys

Ana Ortega-Molina et al. Cell Metab. .

Abstract

Genetic inhibition of PI3K signaling increases energy expenditure, protects from obesity and metabolic syndrome, and extends longevity. Here, we show that two pharmacological inhibitors of PI3K, CNIO-PI3Ki and GDC-0941, decrease the adiposity of obese mice without affecting their lean mass. Long-term treatment of obese mice with low doses of CNIO-PI3Ki reduces body weight until reaching a balance that is stable for months as long as the treatment continues. CNIO-PI3Ki treatment also ameliorates liver steatosis and decreases glucose serum levels. The above observations have been recapitulated in independent laboratories and using different oral formulations of CNIO-PI3Ki. Finally, daily oral treatment of obese rhesus monkeys for 3 months with low doses of CNIO-PI3Ki decreased their adiposity and lowered their serum glucose levels, in the absence of detectable toxicities. Therefore, pharmacological inhibition of PI3K is an effective and safe anti-obesity intervention that could reverse the negative effects of metabolic syndrome in humans.


Figures

Figure 1
Figure 1. Effects of PI3K Inhibition In Vivo
(A) Detection of CNIO-PI3Ki in serum. CNIO-PI3Ki 15 mg/kg was orally administered by gavage (C57BL6 males n = 4 per group; 3–4 months old). Detection was made by mass spectrometry at the indicated times. Dots correspond to individual values and red lines to the average. (B) Left panel, glucose serum levels at the indicated times after CNIO-PI3Ki 15 mg/kg orally administered by gavage (C57BL6 males n = 8–9 per group; 4 months old). Mice were fasted overnight, treated by gavage, and maintained under fasting. Values correspond to the average ± s.d. Right panel, glucose serum levels of ad libitum-fed mice (C57BL6 males n = 16; 3 months old). Dots correspond to individual values and the red line to the average. (C) Immunoblot analyses of the indicated proteins in liver and iBAT extracts 1 or 6 hr after oral administration by gavage of vehicle, GDC-0941 75 mg/kg, or CNIO-PI3Ki 15 mg/kg. (D) G6pc mRNA expression relative to β-actin in liver of mice treated by gavage with vehicle or CNIO-PI3Ki 15 mg/kg at the indicated times. (E) Ucp1 mRNA levels in inguinal (iWAT), epididymal (eWAT), and perirenal (rWAT) white adipose tissue of mice treated by gavage with vehicle or CNIO-PI3Ki 15 mg/kg at the indicated times. Values are relative to the levels in vehicle-treated mice. Bars correspond to the average ± s.d. Mice were under ad libitum feeding all the time in the assays shown in (A), (C), (D), and (E). Statistical significance was determined by the two-tailed Student’s t test: *p < 0.05, ***p < 0.001. See also Figure S1 and Table S1.
Figure 2
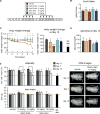
Figure 2. Body Weight Reduction and Decreased Adiposity after CNIO-PI3Ki Treatment
(A) Schematic diagram showing the administration of PI3K inhibitors or vehicle by gavage at the indicated days (gray boxes) to diet-induced obese mice (C57BL6/CBA males n = 4–7 per group; 10 months old). (B) Average food intake per day during treatment with PI3K inhibitors (days marked in gray in A). Color code as in (A). (C) Body weight change relative to day 0 during the treatment (left) or at the last day of treatment (right). For reference, the panel to the right includes a dotted red line corresponding to the relative body weight of control male mice fed with SD. Color code as in (A). (D) Ad libitum glucose serum levels at the end of treatment (day 13). Color code as in (A). (E) Adiposity (top) and lean mass (bottom) at the indicated times according to the diagram in (A) measured by dual-energy X-ray absorptiometry (DXA). Adiposity values correspond to the percentage of fat relative to the sum of lean and fat masses. For reference, the graphs include dotted red lines corresponding to adiposity and lean mass of control male mice fed with SD. Right panel, representative DXA images of two individual mice treated with vehicle or CNIO-PI3Ki (15 mg/kg), respectively. All values correspond to average ± s.d., and statistical significance was determined by the two-tailed Student’s t test: *p < 0.05, **p < 0.01, ***p < 0.001. See also Figure S2.
Figure 3
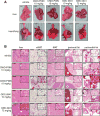
Figure 3. Reduced Liver Steatosis and Increased Browning after CNIO-PI3Ki Treatment
(A) Representative pictures of liver and fat around lung and heart (pericardial fat) in vehicle- and PI3Ki-treated mice at day 13. Bars correspond to 0.5 cm. (B) Representative pictures of H&E-stained sections of the indicated tissues at day 13. eWAT is epididymal WAT, and iBAT is interscapular BAT. In the perirenal fat, K indicates the kidney; in the pericardial fat, L indicates the lungs and H indicates the heart. Bars in the low-magnification pictures correspond to 500 μm, with the exception of pericardial fat pictures, where bars correspond to 2 mm; all bars in the high-magnification insets correspond to 50 μm. Mice are the same as in Figure 2. See also Figure S3.
Figure 4
Figure 4. Reduction of Obesity by Long-Term CNIO-PI3Ki Treatment
(A) Left, body weight curves during 2.5 months of treatment with vehicle or CNIO-PI3Ki (0.1 mg/ml) in the drinking water. All mice were 11 months old at the beginning of the treatments. HFD, mice fed with high-fat diet since 2 months of age; SD, mice fed standard diet (C57BL6 males n = 5–7 per group). Right, body weights at the end of the treatment relative to the weight of SD-fed and vehicle-treated mice. (B) Absolute (left) and relative (right) food and water intake during treatment of HFD-fed mice. Intake was measured in periods of 3 days, and in a total of four periods distributed during the entire treatment period. (C) Adiposity (left) and lean mass (right) measured by dual-energy X-ray absorptiometry (DXA) at the indicated times. Adiposity values correspond to the percentage of fat relative to the sum of lean and fat masses. (D) Ad libitum leptin serum levels at the end of treatment. Dots correspond to individual values and red lines to the average. (E) Ad libitum triglyceride serum levels at the end of treatment of HFD-fed mice. Dots correspond to individual values and red lines to the average. (F) Ad libitum cholesterol serum levels at the end of treatment of HFD-fed mice. Dots correspond to individual values and red lines to the average. Values correspond to the average ± SEM (B) or ± s.d. (C), and statistical significance was determined by the two-tailed Student’s t test: *p < 0.05, **p < 0.01, ***p < 0.001. See also Figure S4.
Figure 5
Figure 5. Reduction of Liver Steatosis and Macrophage Infiltration in eWAT by Long-Term CNIO-PI3Ki Treatment
(A) Representative microscopic pictures of liver sections stained with H&E or oil red O (upper panels), interscapular BAT (iBAT) sections stained with H&E or anti-UCP1 (middle panels), and epididymal WAT (eWAT) sections stained with H&E or anti-F4/80 (lower panels). Bars in the low-magnification pictures correspond to 200 μm; bars in the high-magnification insets correspond to 50 μm. (B) Ad libitum alanine aminotransferase (ALT) serum levels at the end of long-term treatment. Dots correspond to individual values and red lines to the average. (C) IL-6 expression in liver. Values are relative to the levels in SD-fed and vehicle-treated mice. Values correspond to the average ± s.d. (D) Emr1 and CD68 mRNA levels in eWAT. Values are relative to the levels in SD-fed and vehicle-treated mice. Bars correspond to the average ± s.d. Statistical significance was determined by the two-tailed Student’s t test: *p < 0.05. Mice in this figure are the same as in Figure 4, and all the analyses were performed at the end of the long-term treatment.
Figure 6
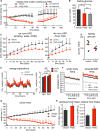
Figure 6. Properties of CNIO-PI3Ki on Obesity and Energy Expenditure
(A) Body weight change relative to day 0. Mice of 2 months of age were fed with HFD during 8 months. At this time (day 0), mice were divided into two groups and treated with vehicle or CNIO-PI3Ki (0.1 mg/ml) in the drinking water during 5 months. At day 155, treatment with vehicle or CNIO-PI3Ki was removed from the water for the rest of the assay. Mice were fed with HFD during the entire assay. Values correspond to the average ± s.d. C57BL6 males n = 9–10 per group. Significant weight difference between groups lasted from day 7 to day 180. (B) Fasting glucose level of HFD-fed mice at the end of the procedure (5 months with treatment and 48 days treatment-free) compared to SD-fed control mice. (C) Left, performed in the CNIO, body weight change relative to day 0. Mice of 2 months of age were put simultaneously on a HFD with CNIO-PI3Ki (0.1 mg/ml) or vehicle in the drinking water for 20 weeks. Values correspond to the average ± s.d. C57BL6 males n = 8–10 per group. Significant weight difference starts at day 3. Right, performed in the NIA, body weight change relative to day 0. Mice of 28 weeks of age and fed with SD were put on a HFD or HFD supplemented with CNIO-PI3Ki (0.17 g of drug per kg of food) for 12 weeks. Values correspond to the average ± s.d. C57BL6 males (control n = 18; CNIO-PI3Ki n = 24). Differences in body weight were significant after first weight measurement. (D) Fasting glucose levels of mice after 12 weeks with or without CNIO-PI3Ki treatment in their HFD food. Animals (control n = 8; CNIO-PI3Ki n = 8) are from the assay in (C) (right panel, performed in the NIA). Dots correspond to individual values and red bars to the mean. (E) Energy expenditure (EE) recorded during 80 hr (left) and mean energy expenditure (right) measured during light and dark period of control and CNIO-PI3Ki-treated mice. Animals (control n = 7; CNIO-PI3Ki n = 8) are from the assay in (C) (right panel, performed in the NIA). (F) Whole-body and shoulder area temperature of mice on HFD with or without CNIO-PI3Ki treatment (same animals as in C, right panel, performed in the NIA) and of control lean mice on SD (n = 6–9 per group). Temperature was recorded every second during 10 min. (G) Body weight change relative to day 0. Hyperphagic ob/ob male mice (12 weeks old) fed with SD and treated with vehicle or CNIO-PI3Ki (0.1 mg/ml) in the drinking water during 16 weeks. C57BL6 males ob/ob n = 10 per group. Significant weight difference between groups starts at day 3. (H) Absolute (left) and relative (right) food intake of ob/ob mice treated with vehicle or CNIO-PI3Ki relative to their body weight. Intake was measured in periods of 4 days, and a total of two periods distributed in the middle of the treatment. Values correspond to the average ± s.d. Statistical significance was determined by the two-tailed Student’s t test: *p < 0.05, **p < 0.01. See also Figure S5.
Figure 7
Figure 7. Effects of CNIO-PI3Ki on Obese Rhesus Monkeys
(A) Fold change of adiposity after 12 weeks of treatment with vehicle (n = 9) or CNIO-PI3Ki (n = 10). Values correspond to the ratio between adiposity at week 12 and adiposity at baseline, for each monkey. Adiposity was measured in the trunk (adiposity = fat/(fat + lean)%). (B) Fold change of fasting glucose (same representation as in A) for each monkey at week 12, relative to baseline. Statistical significance was determined by the two-tailed Student’s t test. See also Figure S6.

Comment in

References

    1. Barzilai N, Huffman DM, Muzumdar RH, Bartke A. The critical role of metabolic pathways in aging. Diabetes. 2012;61:1315–1322. - PMC - PubMed
    1. Becattini B, Marone R, Zani F, Arsenijevic D, Seydoux J, Montani JP, Dulloo AG, Thorens B, Preitner F, Wymann MP, Solinas G. PI3Kγ within a nonhematopoietic cell type negatively regulates diet-induced thermogenesis and promotes obesity and insulin resistance. Proc Natl Acad Sci USA. 2011;108:E854–E863. - PMC - PubMed
    1. Cava E, Fontana L. Will calorie restriction work in humans? Aging (Albany, N.Y Online) 2013;5:507–514. - PMC - PubMed
    1. Chattopadhyay M, Selinger ES, Ballou LM, Lin RZ. Ablation of PI3K p110-α prevents high-fat diet-induced liver steatosis. Diabetes. 2011;60:1483–1492. - PMC - PubMed
    1. Colman RJ, Anderson RM, Johnson SC, Kastman EK, Kosmatka KJ, Beasley TM, Allison DB, Cruzen C, Simmons HA, Kemnitz JW, Weindruch R. Caloric restriction delays disease onset and mortality in rhesus monkeys. Science. 2009;325:201–204. - PMC - PubMed

Publication types

Substances