. 2015 Jun 12;290(24):14986-5003.
doi: 10.1074/jbc.M114.624254. Epub 2015 Mar 28.

Methylxanthines Increase Expression of the Splicing Factor SRSF2 by Regulating Multiple Post-transcriptional Mechanisms

Affiliations

Methylxanthines Increase Expression of the Splicing Factor SRSF2 by Regulating Multiple Post-transcriptional Mechanisms

Jia Shi et al. J Biol Chem. .

Abstract

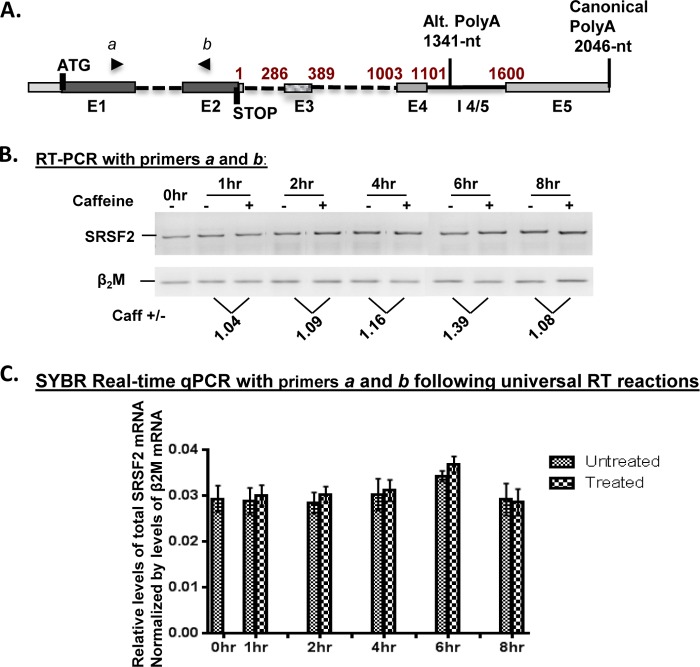
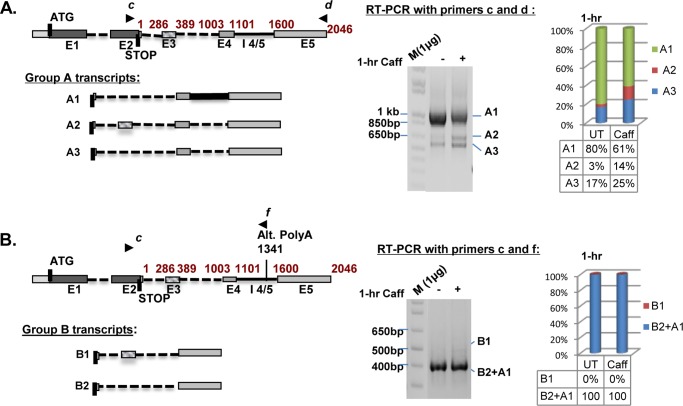
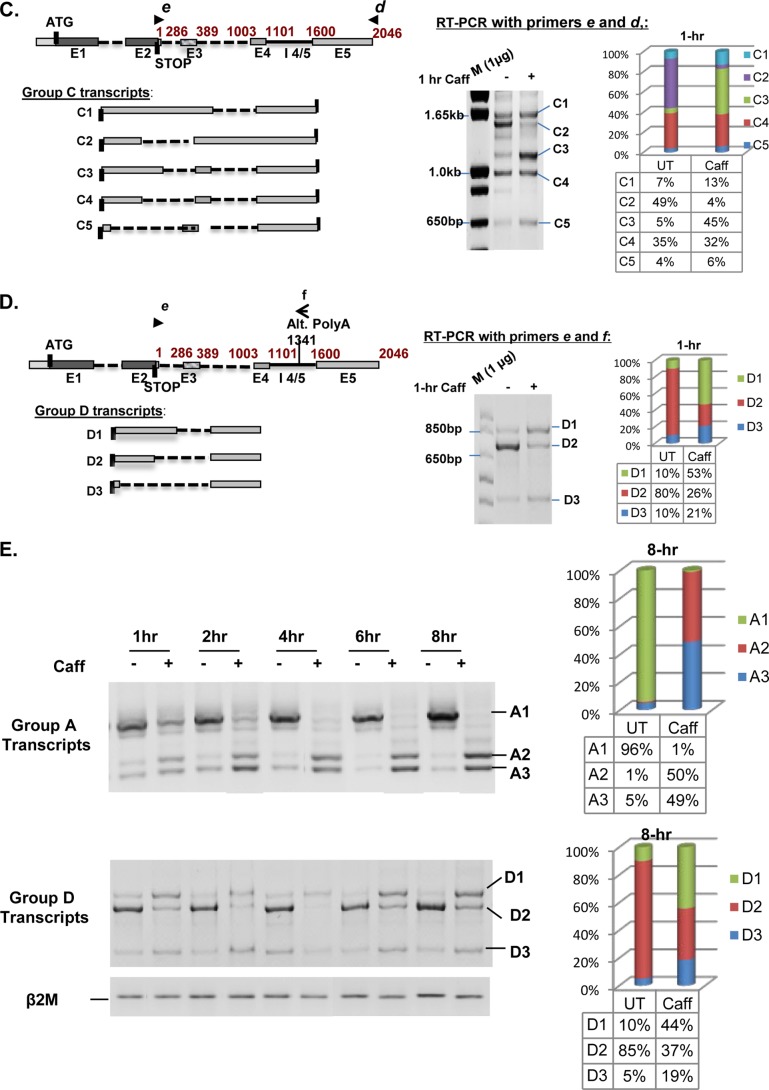
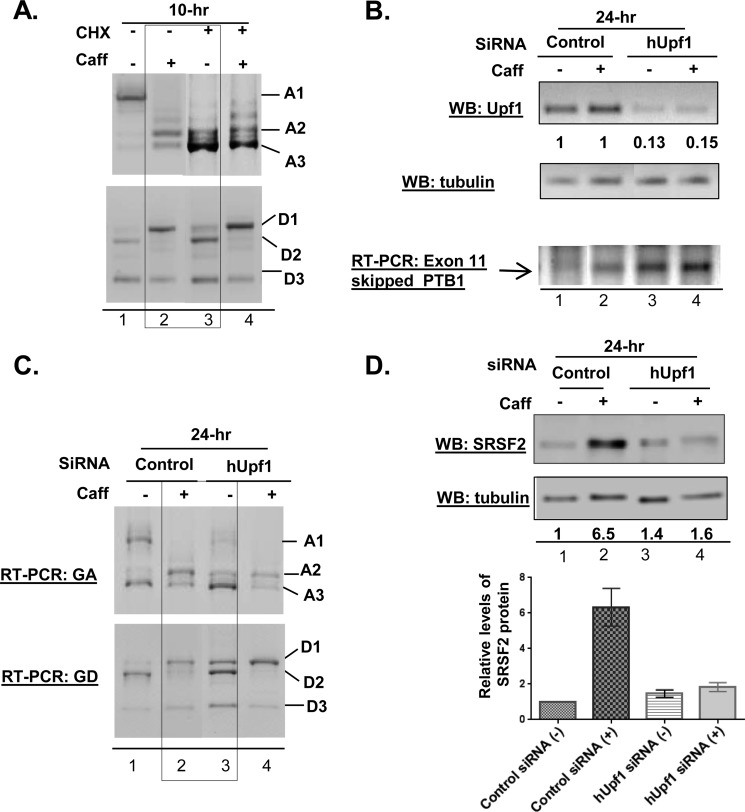
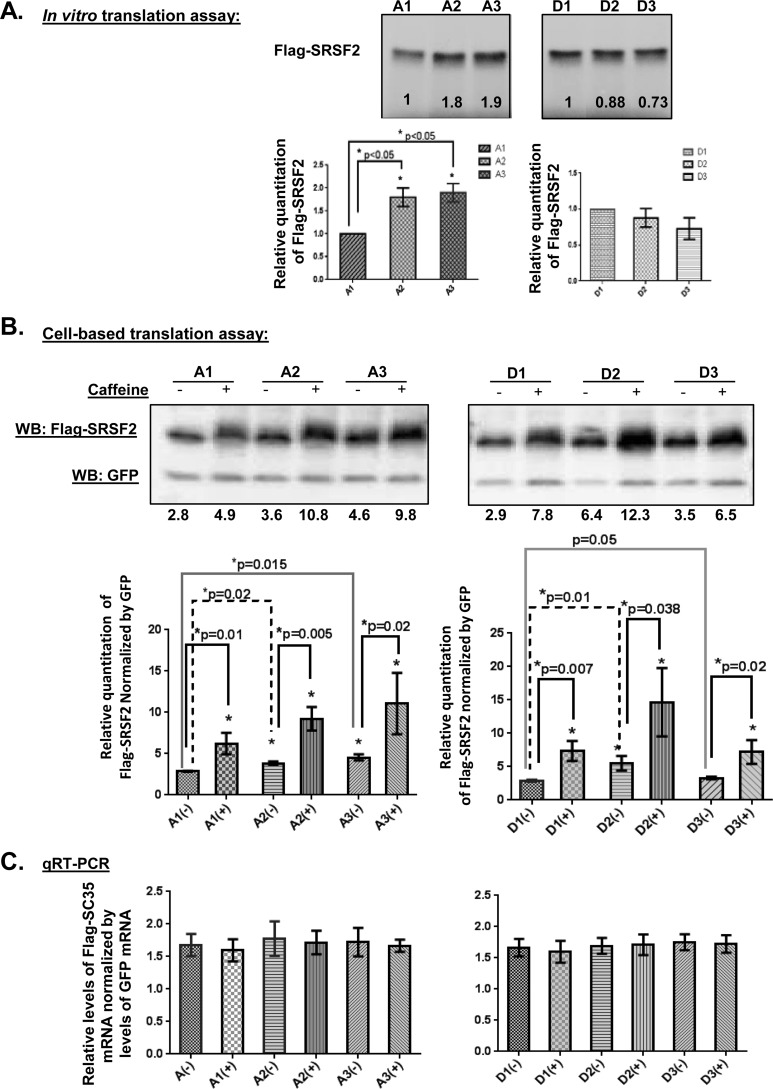
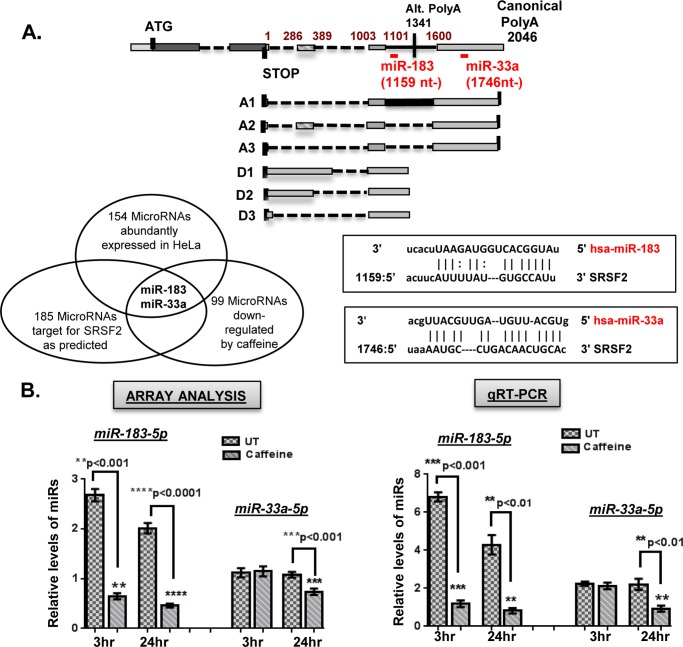
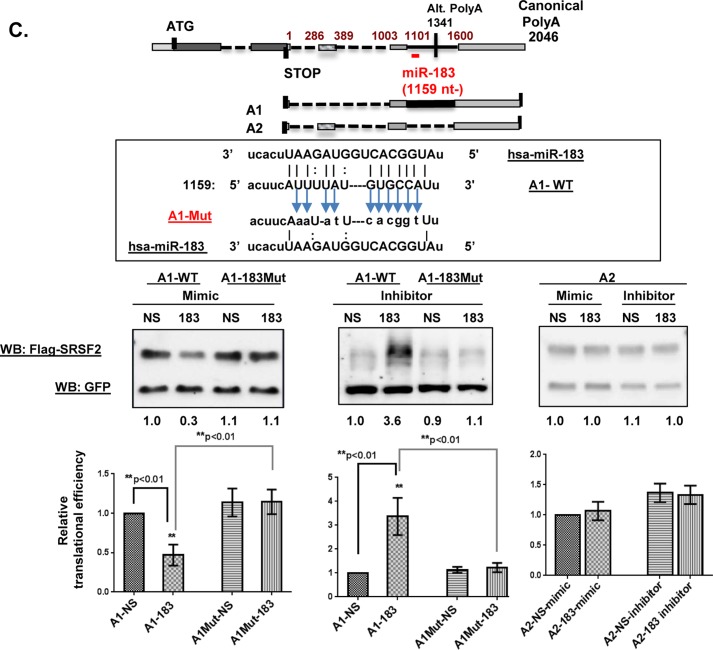
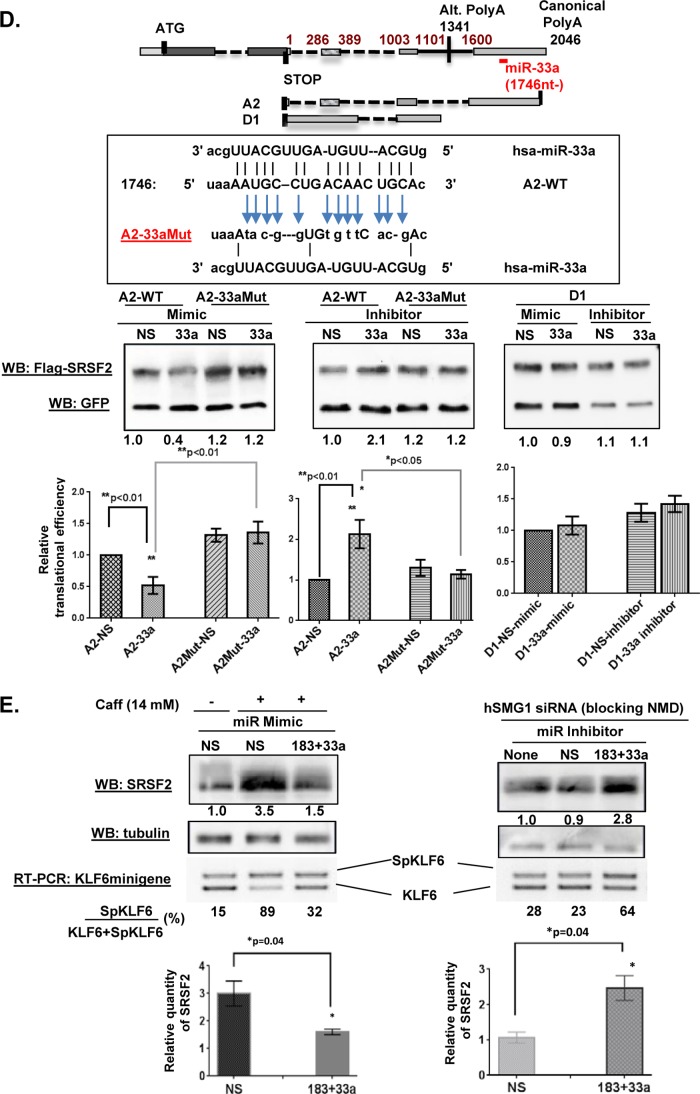
We have previously reported that the methylxanthine caffeine increases expression of the splicing factor SRSF2, the levels of which are normally controlled by a negative autoregulatory loop. In the present study we have investigated the mechanisms by which methylxanthines induce this aberrant overexpression. RT-PCR analyses suggested little impact of caffeine on SRSF2 total mRNA levels. Instead, caffeine induced changes in the levels of SRSF2 3' UTR splice variants. Although some of these variants were substrates for nonsense-medicated decay (NMD), and could potentially have been stabilized by caffeine-mediated inhibition of NMD, down-regulation of NMD by a genetic approach was not sufficient to reproduce the phenotype. Furthermore, cell-based assays demonstrated that some of the caffeine-induced variants were intrinsically more efficiently translated than others; the addition of caffeine increased the translational efficiency of most SRSF2 transcripts. MicroRNA array analyses revealed a significant caffeine-mediated decrease in the expression of two SRSF2-targeting miRs, both of which were shown to repress translation of specific SRSF2 splice variants. These data support a complex model whereby caffeine down-regulates SRSF2-targeting microRNAs, leading to an increase in SRSF2 translation, which in turn induces SRSF2 splicing. SRSF2 splice variants are then stabilized by caffeine-mediated NMD inhibition, breaking the normal negative feedback loop and allowing the aberrant increase in SRSF2 protein levels. These findings highlight the complexity of SRSF2 gene regulation, and suggest ways in which SRSF2 expression may be dysregulated in disease.

Keywords: alternative splicing; caffeine, SRSF2, nonsense-mediated decay; gene regulation; homeostasis; microRNA (miRNA); translation regulation.


Figures

FIGURE 1.
FIGURE 1.
Methylxanthines induce alternative splicing of KLF6 and increase levels of SRSF2. A, RT-PCR analyses on samples treated with methylxanthines (14 mm), including pentoxifylline, caffeine, theophylline, and isocaffeine, revealed various degrees of SpKLF6 induction following 18 h of treatment. B, Western blotting (WB) analyses detected increased levels of SRSF2 in samples treated with pentoxifylline, caffeine, and theophylline; isocaffeine had a minimal effect. The order of magnitude of SRSF2 increase is pentoxifylline > caffeine > theophylline > isocaffeine, which coincided with the degree of SpKLF6 AS induction. C, cytotoxicity assays revealed considerable cell death following pentoxifylline treatment when compared with caffeine, at the effective concentration (14 mm) used to induce maximal alternative splicing of KLF6. UT, untreated.
FIGURE 2.
FIGURE 2.
Caffeine does not change total SRSF2 mRNA levels. A, schematic illustration of SRSF2 gene structure. E1, exon 1; E2, exon 2; the canonical polyadenylation site is found 2046 nt downstream of the stop codon, whereas an alternative polyadenylation site is located at 1341 nt downstream of the stop codon. B, semi-quantitative RT-PCR analysis using primers “a” and “b” on RNA samples collected from HeLa cells with or without caffeine treatment at different time points. No change in SRSF2 total mRNA was observed following caffeine (14 mm) treatment. β2-microglobulin (β2M) RNA was used as a loading control. This assay was repeated at least three times with consistent results. Statistical analyses were performed using GraphPad Prism 6 software, and significance was determined by the non-parametric t tests. A p < 0.05 was considered significant. C, SYBR® real-time RT-PCR analyses confirmed the results from semi-quantitative RT-PCR, i.e. that no significant change in total SRSF2 mRNA was induced by caffeine. Error bars represent mean ± S.D.
FIGURE 3.
FIGURE 3.
Caffeine induces rapid changes in the 3′ UTR of SRSF2 RNA (A–D). The known Group A (GA) transcripts as well as the putative Groups B, C, and D (GB, GC, GD) transcripts are schematically depicted in the left panels. Semi-quantitative RT-PCR was performed with different primers to query the existence of both known and putative SRSF2 transcripts in HeLa cells. A, analyses using primers c and d on samples with or without 1-h caffeine treatment revealed rapid changes in levels of the GA splice variants (right panel). B, analysis using primers c and f confirmed the existence of putative GB SRSF2 transcripts that utilize the alternative polyadenylation site instead of the canonical polyadenylation site. Caffeine treatment (14 mm) had minimal effect on the B1 transcript (inclusion of E3) (right panel). Note that primers c and f will also amplify A1. C, analysis using primers e and d confirmed the presence of GC transcripts that utilize the canonical polyadenylation site but select alternative E2 5′ splice sites at positions 1101 (C1), 389 (C2 and C4), 543 (C3), or 60 nt (C5) downstream of the stop codon. Caffeine induced changes in GC transcripts. GC transcripts are poorly expressed because they required 5 additional cycles of PCR to be comparably visualized. D, analysis using primers e and f confirmed novel GD transcripts that utilize the alternative polyadenylation site as well as alternative E2 5′ splice sites. Caffeine (1 h) induced D1 and D3 at the expense of D2. E, time course analyses of caffeine-induced alternative splicing changes within the 3′ UTR among GA and GD transcripts.
FIGURE 3.
FIGURE 3.
Caffeine induces rapid changes in the 3′ UTR of SRSF2 RNA (A–D). The known Group A (GA) transcripts as well as the putative Groups B, C, and D (GB, GC, GD) transcripts are schematically depicted in the left panels. Semi-quantitative RT-PCR was performed with different primers to query the existence of both known and putative SRSF2 transcripts in HeLa cells. A, analyses using primers c and d on samples with or without 1-h caffeine treatment revealed rapid changes in levels of the GA splice variants (right panel). B, analysis using primers c and f confirmed the existence of putative GB SRSF2 transcripts that utilize the alternative polyadenylation site instead of the canonical polyadenylation site. Caffeine treatment (14 mm) had minimal effect on the B1 transcript (inclusion of E3) (right panel). Note that primers c and f will also amplify A1. C, analysis using primers e and d confirmed the presence of GC transcripts that utilize the canonical polyadenylation site but select alternative E2 5′ splice sites at positions 1101 (C1), 389 (C2 and C4), 543 (C3), or 60 nt (C5) downstream of the stop codon. Caffeine induced changes in GC transcripts. GC transcripts are poorly expressed because they required 5 additional cycles of PCR to be comparably visualized. D, analysis using primers e and f confirmed novel GD transcripts that utilize the alternative polyadenylation site as well as alternative E2 5′ splice sites. Caffeine (1 h) induced D1 and D3 at the expense of D2. E, time course analyses of caffeine-induced alternative splicing changes within the 3′ UTR among GA and GD transcripts.
FIGURE 4.
FIGURE 4.
Caffeine (14 mm) does not change the levels of TARDBP and HnRNP F/H to influence SRSF2 AS at the 3′ UTR. Western blotting (WB) analysis was performed on samples collected at the indicated time points. Tubulin was used as the internal control.
FIGURE 5.
FIGURE 5.
Inhibition of NMD is not sufficient to increase SRSF2 levels. A, cycloheximide-mediated NMD inhibition only resulted in partial mimics of the effect of caffeine on alternative splicing pattern in GA and GD transcripts. B, RNAi reduced the hUpf1 level by ∼85%, inhibiting NMD as evidenced by the accumulation of a PTB1 splice variant (exon 11-skipped PTB1), known to be an NMD target. Note that caffeine treatment alone (lane 2) also resulted in accumulation of exon 11-skipped PTB1, indicating some degree of inhibition of NMD by caffeine. C, the SRSF2 3′ UTR splicing pattern induced by caffeine was only partially reproduced by hUpf1 knockdown-mediated NMD inhibition. D, Western blot (WB) analysis revealed that hUpf1 RNAi-mediated NMD inhibition was not sufficient to increase levels of SRSF2 protein. Quantitation was normalized to input control tubulin. Statistical analysis was performed based on data from at least three experiments. Error bars represent mean ± S.D.
FIGURE 6.
FIGURE 6.
GA and GD SRSF2 variants exhibit different translational efficiencies and caffeine (14 mm) increases their translation. A, in vitro translation assays detected a higher intrinsic translational efficiency of A2 and A3 when compared with A1 transcripts. No significant difference was detected among GD SRSF2 variants by this assay. B, cell-based translation assays also indicated that the caffeine-induced transcripts A2 and A3 were translated at a higher rate as compared with A1. Caffeine increased translational efficiency of all SRSF2 variants. SRSF2 cDNA in-frame with an N-terminal FLAG tag was tethered with individual SRSF2 3′ UTRs and inserted into a mammalian expression plasmid. Co-transfection assays introduced both SRSF2 and GFP constructs into HeLa cells. Western blot analysis was utilized to quantitate relative translation efficiency. GFP was used as a control for transfection efficiency. C, real-time RT-PCR analyses of FLAG-SRSF2 and GFP mRNA in the cell-based translational efficiency assay. The relative levels of FLAG-SRSF2 mRNA of each SRSF2 variants were normalized to levels of GFP mRNA from the same cell populations/experimental conditions. Statistical analysis was performed based on data from at least three repeats using GraphPad PRISM 6 software, non-parametric t tests. A difference with a p < 0.05 was considered significant. Error bars represent mean ± S.D.
FIGURE 7.
FIGURE 7.
Caffeine decreases levels of SRSF2-targeting miRs to increase translational efficiency of certain SRSF2 transcripts. A, strategy for identifying putative caffeine-decreased SRSF2-targeting miRs in HeLa cells (lower, left) and schematic of miR binding sites within the SRSF2 3′ UTR (top). Two candidates were selected (miR-183-5p and miR-33a-5p) and mapped to GA and GD transcripts. B, microRNA array analyses revealed caffeine-mediated decreases in the levels of miR-183-5p and miR-33a-5p (left). This decrease was validated by quantitative RT-PCR (right). The final Ct value was an average of 5 repeats of each assay, and each assay was repeated three times. A difference with a p < 0.05 was considered significant. C, the miR-183-5p binding site in the FLAG-SRSF2 A1 transcript was disabled by site-directed mutagenesis (top). Either A-1WT or A1–183Mut was co-transfected with either miR-183-5p mimics or inhibitor. GFP was included in the transfection mixture as transfection efficiency control. Each assay was repeated three times. A difference at p < 0.05 was considered significant. D, the miR-33a-5p binding site in FLAG-SRSF2 A2 transcript was disabled by site-directed mutagenesis (top). Either A-2WT or A2–33aMut was co-transfected together with miR-33a-5p mimics or inhibitors. GFP was included as the transfection efficiency control. E, levels of endogenous SRSF2 and alternative splicing of KLF6 minigene were analyzed after cells were transfected with miR mimics in the presence of caffeine (left panel) or miR inhibitors in the presence of hSMG1 siRNA to block NMD (right panel). Nonspecific miRs served as controls. Each assay was repeated three times. Statistical analyses were performed using GraphPad Prism version 6 software, and significance was determined by the non-parametric t test. A difference with a p < 0.05 was considered significant. Error bars represent mean ± S.D. WB, Western blot.
FIGURE 7.
FIGURE 7.
Caffeine decreases levels of SRSF2-targeting miRs to increase translational efficiency of certain SRSF2 transcripts. A, strategy for identifying putative caffeine-decreased SRSF2-targeting miRs in HeLa cells (lower, left) and schematic of miR binding sites within the SRSF2 3′ UTR (top). Two candidates were selected (miR-183-5p and miR-33a-5p) and mapped to GA and GD transcripts. B, microRNA array analyses revealed caffeine-mediated decreases in the levels of miR-183-5p and miR-33a-5p (left). This decrease was validated by quantitative RT-PCR (right). The final Ct value was an average of 5 repeats of each assay, and each assay was repeated three times. A difference with a p < 0.05 was considered significant. C, the miR-183-5p binding site in the FLAG-SRSF2 A1 transcript was disabled by site-directed mutagenesis (top). Either A-1WT or A1–183Mut was co-transfected with either miR-183-5p mimics or inhibitor. GFP was included in the transfection mixture as transfection efficiency control. Each assay was repeated three times. A difference at p < 0.05 was considered significant. D, the miR-33a-5p binding site in FLAG-SRSF2 A2 transcript was disabled by site-directed mutagenesis (top). Either A-2WT or A2–33aMut was co-transfected together with miR-33a-5p mimics or inhibitors. GFP was included as the transfection efficiency control. E, levels of endogenous SRSF2 and alternative splicing of KLF6 minigene were analyzed after cells were transfected with miR mimics in the presence of caffeine (left panel) or miR inhibitors in the presence of hSMG1 siRNA to block NMD (right panel). Nonspecific miRs served as controls. Each assay was repeated three times. Statistical analyses were performed using GraphPad Prism version 6 software, and significance was determined by the non-parametric t test. A difference with a p < 0.05 was considered significant. Error bars represent mean ± S.D. WB, Western blot.
FIGURE 8.
FIGURE 8.
Proposed model illustrating the mechanisms by which caffeine increases SRSF2 protein expression. Under normal conditions, SRSF2 homeostasis is maintained by a complex interplay of post-transcriptional mechanisms including microRNA-mediated translation repression (left panel) and an alternative splicing associated NMD (AS-NMD), the autoregulatory feedback loop (middle panel). Translation of the major SRSF2 transcripts A1 and D2 are suppressed by specific miRs binding to the 3′ UTR. When SRSF2 levels are increased due to intrinsic or environmental signals, the increased SRSF2 promotes alternative splicing at the 3′ UTR, resulting in multiple splice variants such as A2, A3, D1, and D3. These transcripts are destined for NMD, thereby decreasing the level of SRSF2 mRNA and the production of SRSF2 protein. Caffeine has two key effects on SRSF2 homeostasis regulation. First, caffeine decreases the levels of SRSF2-targeting miRs, releasing translational repression of the major SRSF2 transcripts, allowing a surge of SRSF2 protein synthesis. This increased SRSF2 triggers the synthesis of splice variants A2, A3, D1, and D3, normally substrates for NMD. However, caffeine also inhibits NMD, blocking the degradation of SRSF2 transcript variants. Thus, caffeine affects multiple regulatory mechanisms breaking the negative feedback loop resulting in a sustained increase of SRSF2 protein.

Similar articles

Cited by

References

    1. Takeda J., Suzuki Y., Sakate R., Sato Y., Gojobori T., Imanishi T., Sugano S. (2010) H-DBAS: human-transcriptome database for alternative splicing: update 2010. Nucleic Acids Res. 38, D86-D90 - PMC - PubMed
    1. Bauman J. A., Kole R. (2011) Modulation of RNA splicing as a potential treatment for cancer. Bioeng. Bugs 2, 125–128 - PMC - PubMed
    1. McGlincy N. J., Smith C. W. (2008) Alternative splicing resulting in nonsense-mediated mRNA decay: what is the meaning of nonsense? Trends Biochem. Sci. 33, 385–393 - PubMed
    1. Glisovic T., Bachorik J. L., Yong J., Dreyfuss G. (2008) RNA-binding proteins and post-transcriptional gene regulation. FEBS Lett. 582, 1977–1986 - PMC - PubMed
    1. Ajay S. S., Athey B. D., Lee I. (2010) Unified translation repression mechanism for microRNAs and upstream AUGs. BMC Genomics 11, 155. - PMC - PubMed

Publication types