. 2015 Jun:52:140-7.
doi: 10.1016/j.biomaterials.2015.01.034. Epub 2015 Feb 24.

3D surface topology guides stem cell adhesion and differentiation

Affiliations

3D surface topology guides stem cell adhesion and differentiation

Priyalakshmi Viswanathan et al. Biomaterials. 2015 Jun.

Abstract

Polymerized high internal phase emulsion (polyHIPE) foams are extremely versatile materials for investigating cell-substrate interactions in vitro. Foam morphologies can be controlled by polymerization conditions to result in either open or closed pore structures with different levels of connectivity, consequently enabling the comparison between 2D and 3D matrices using the same substrate with identical surface chemistry conditions. Additionally, here we achieve the control of pore surface topology (i.e. how different ligands are clustered together) using amphiphilic block copolymers as emulsion stabilizers. We demonstrate that adhesion of human mesenchymal progenitor (hES-MP) cells cultured on polyHIPE foams is dependent on foam surface topology and chemistry but is independent of porosity and interconnectivity. We also demonstrate that the interconnectivity, architecture and surface topology of the foams has an effect on the osteogenic differentiation potential of hES-MP cells. Together these data demonstrate that the adhesive heterogeneity of a 3D scaffold could regulate not only mesenchymal stem cell attachment but also cell behavior in the absence of soluble growth factors.

Keywords: Cell signaling; Osteogenesis; Stem cell; Surface topology.


Figures

Figure 1
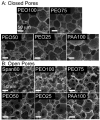
Figure 1. 3D scaffold morphologies
Scanning electron micrographs of polyHIPE foams with (A) closed pore morphology and (B) interconnected open pore morphology for the indicated copolymer mixtures. Scale bars are 50 μm.
Figure 2
Figure 2. Differential cell adhesion on polyHIPEs
At the far left is a schematic of the surface topology on the pore walls of polyHIPE foams as a function of PEO molar ratio. Confocal images of filamentous actin (red) and nucleus (blue) staining of hES-MPs cultured on the foams (auto-fluorescence in green) for 7 days show differential adhesion and cell spreading on copolymer functionalized closed porous and open porous foams compared to Span80 functionalized foams. Solid arrowheads indicate hES-MPs adhering and spreading around the pore struts of the closed porous foams. Open arrowheads indicate hES-MP spreading through the interconnected pores. Dashed lines indicate regions magnified in other images.
Figure 3
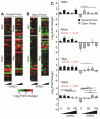
Figure 3. Lineage Specific Gene Expression
Lineage specific gene expression data as a function of foam PEO% represented as (A) heat maps comparing fold difference change of open and closed porous foams (B) mean fold change comparing open and closed porous foams. The correlation coefficient between the fold change of open and closed porous foams as a function of PEO% is noted. Data is mean ± SEM, n= 3.
Figure 4
Figure 4. hES-MP calcium deposition
Calcium deposition assayed by Alizarin Red S. Relative absorbance at 405 for cells treated with and without Dex. n=9. Significant differences indicated by * p < 0.05.
Figure 5
Figure 5. Matrix and mineral deposition
Representative scanning electron micrographs of hES-MP cells cultured on block copolymer scaffolds for 28 days without DEX (A) and with DEX (C). High magnification images of cells cultured on PEO50 and PEO75 compositions (B) without DEX show cell secreted ECM and mineral deposition indicated by arrowheads and arrows respectively. Arrows indicate mineral nodules.
Figure 6
Figure 6. Signalling-Osteogenic Correlation
(A) Average fold change of signalling and osteogenic genes as a function of foam PEO molar% comparing closed (top) and open (bottom) porous foams. Correlation coefficients between signalling and osteogenic profiles are noted. Data is mean ± SEM. *p < 0.05 and N.S. = not significant for two-way ANOVA assessment of significance for foam type (left) and composition (right) variables for signalling (grey) and osteogenic genes (black). (B) Correlation coefficients tabulated between average fold change of osteogenic genes and specific signalling genes (indicated by name) as a function of PEO molar%. A high correlation coefficient indicates influence by a particular signalling gene on osteogenic gene expression.

References

    1. Geiger B, Bershadsky A, Pankov R, Yamada KM. Transmembrane crosstalk between the extracellular matrix--cytoskeleton crosstalk. Nat Rev Mol Cell Biol. 2001;2:793–805. - PubMed
    1. Huang S, Ingber DE. The structural and mechanical complexity of cell-growth control. Nat Cell Biol. 1999;1:E131–8. - PubMed
    1. Reilly GC, Engler AJ. Intrinsic extracellular matrix properties regulate stem cell differentiation. J Biomech. 2010;43:55–62. - PubMed
    1. Discher DE, Mooney DJ, Zandstra PW. Growth factors, matrices, and forces combine and control stem cells. Science. 2009;324:1673–7. - PMC - PubMed
    1. Vogel V, Sheetz M. Local force and geometry sensing regulate cell functions. Nat Rev Mol Cell Biol. 2006;7:265–75. - PubMed

Publication types