. 2015 Jun:52:251-61.
doi: 10.1016/j.biomaterials.2015.02.040. Epub 2015 Feb 28.

In vivo multimodal magnetic particle imaging (MPI) with tailored magneto/optical contrast agents

Affiliations

In vivo multimodal magnetic particle imaging (MPI) with tailored magneto/optical contrast agents

Hamed Arami et al. Biomaterials. 2015 Jun.

Abstract

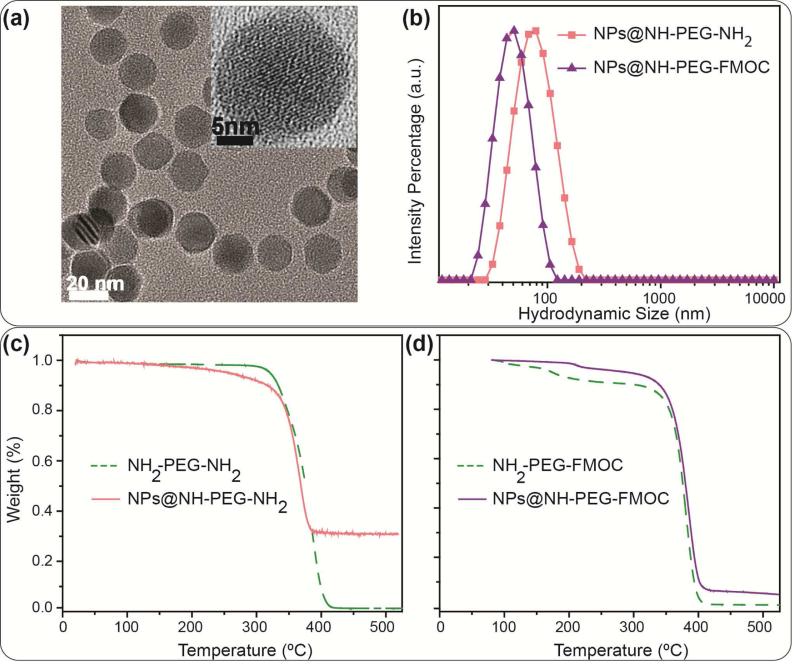
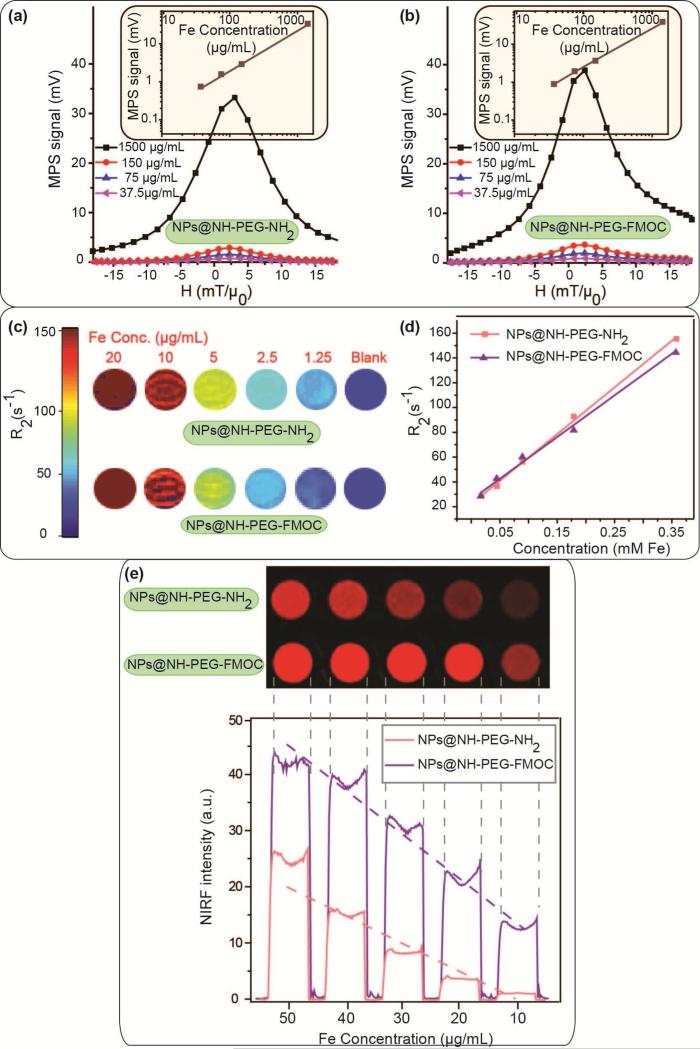
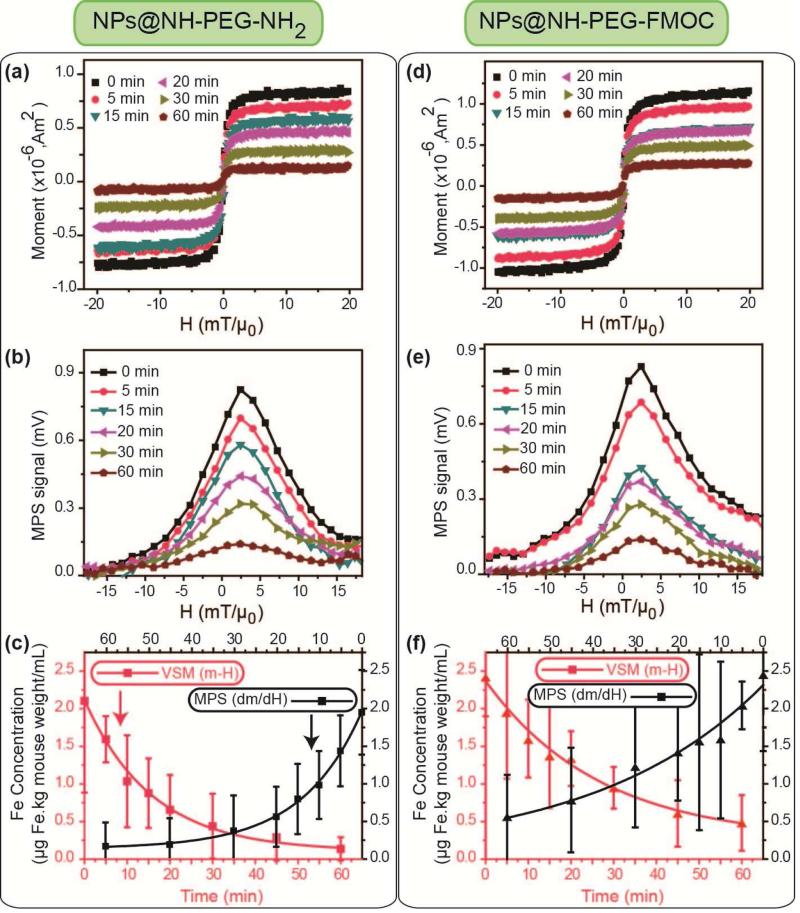
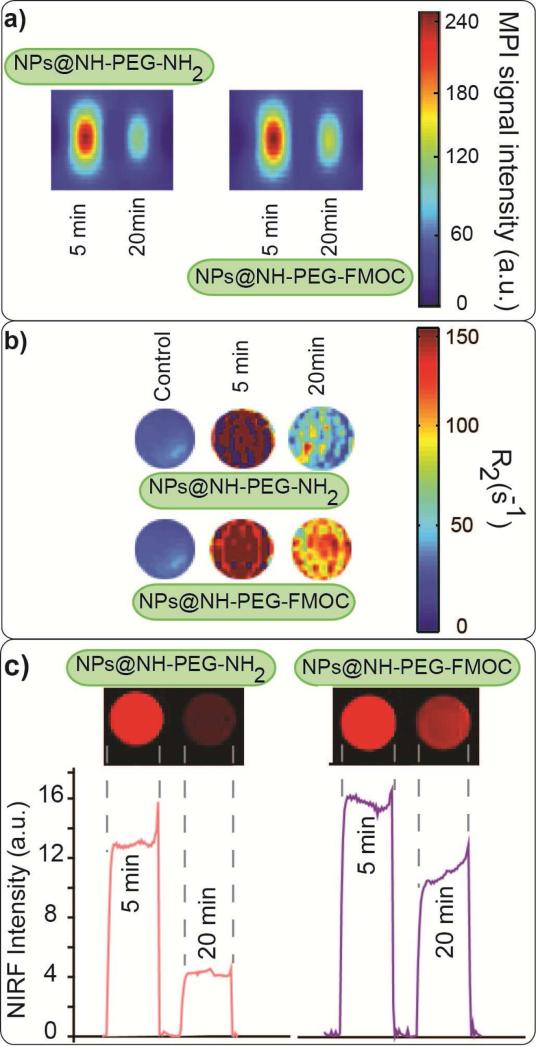
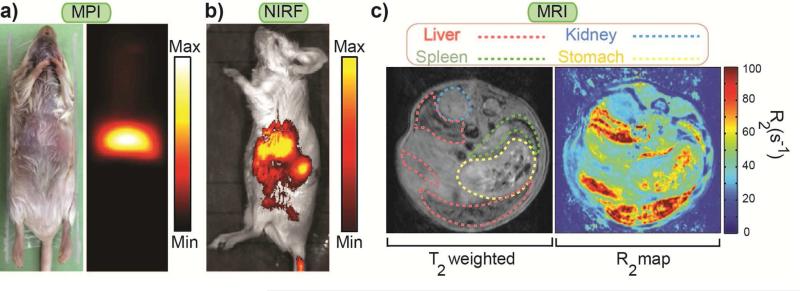
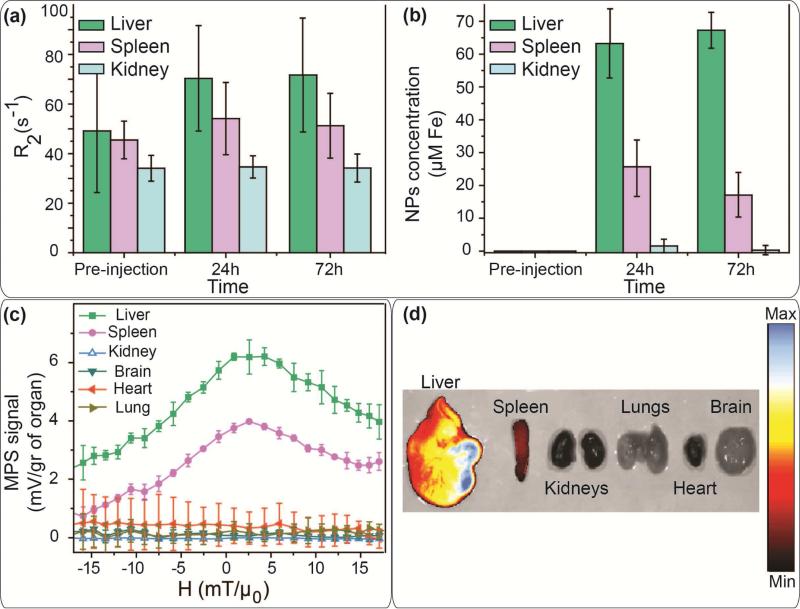
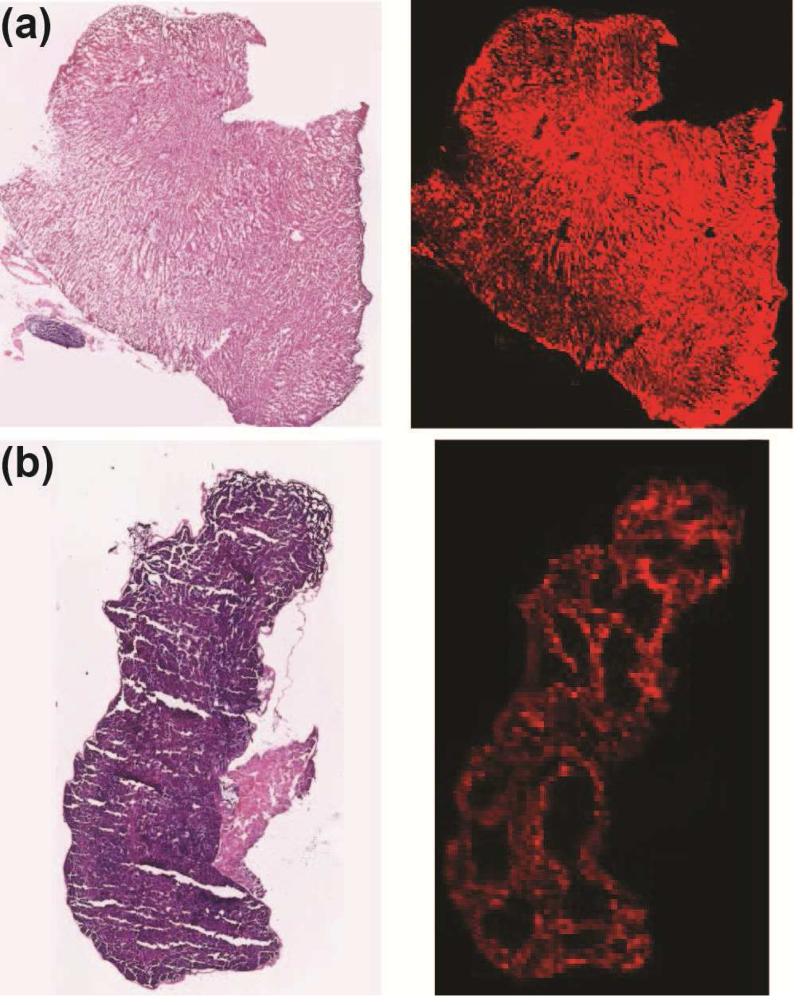
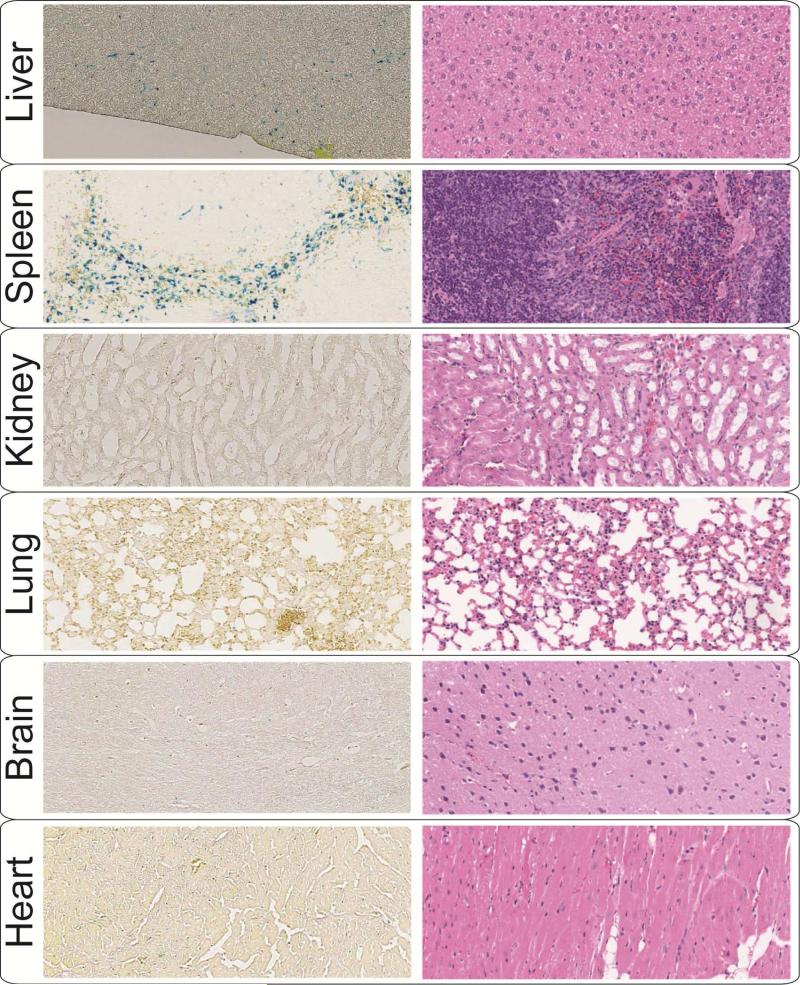
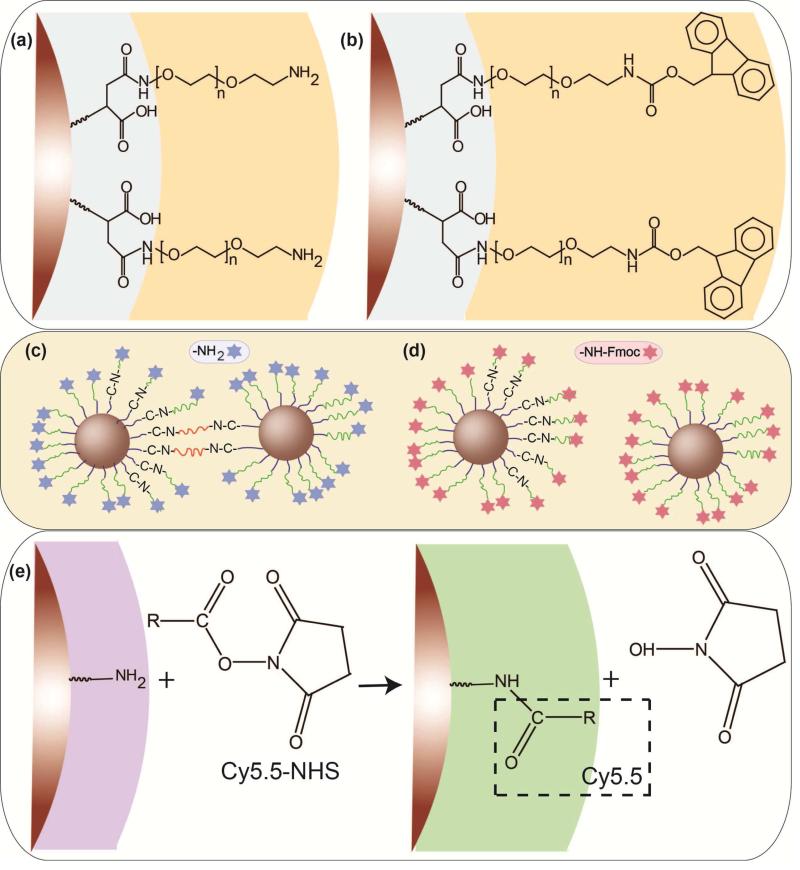
Magnetic Particle Imaging (MPI) is a novel non-invasive biomedical imaging modality that uses safe magnetite nanoparticles as tracers. Controlled synthesis of iron oxide nanoparticles (NPs) with tuned size-dependent magnetic relaxation properties is critical for the development of MPI. Additional functionalization of these NPs for other imaging modalities (e.g. MRI and fluorescent imaging) would accelerate screening of the MPI tracers based on their in vitro and in vivo performance in pre-clinical trials. Here, we conjugated two different types of poly-ethylene-glycols (NH2-PEG-NH2 and NH2-PEG-FMOC) to monodisperse carboxylated 19.7 nm NPs by amide bonding. Further, we labeled these NPs with Cy5.5 near infra-red fluorescent (NIRF) molecules. Bi-functional PEG (NH2-PEG-NH2) resulted in larger hydrodynamic size (∼98 nm vs. ∼43 nm) of the tracers, due to inter-particle crosslinking. Formation of such clusters impacted the multimodal imaging performance and pharmacokinetics of these tracers. We found that MPI signal intensity of the tracers in blood depends on their plasmatic clearance pharmacokinetics. Whole body mice MPI/MRI/NIRF, used to study the biodistribution of the injected NPs, showed primary distribution in liver and spleen. Biodistribution of tracers and their clearance pathway was further confirmed by MPI and NIRF signals from the excised organs where the Cy5.5 labeling enabled detailed anatomical mapping of the tracers.in tissue sections. These multimodal MPI tracers, combining the strengths of each imaging modality (e.g. resolution, tracer sensitivity and clinical use feasibility) pave the way for various in vitro and in vivo MPI applications.

Keywords: Biodistribution and pharmacokinetics; Magnetic nanoparticles, Magnetic Resonance Imaging; Magnetic particle imaging; Multimodal contrast agents.


Figures

Fig. 1
Fig. 1
(a) TEM image showing the core size distribution and morphology of the NPs. The inset HRTEM image shows the lattice fringes of a single nanoparticle. (b) DLS intensity data showing the hydrodynamic size distribution of the NPs functionalized with NH2-PEG-NH2 and NH2-PEG-FMOC. (c) and (d) Thermogravimetric (TG) analysis data showing the weight percentage of the PEG molecules in each type of the NPs – notice the lower weight loss in NPs coated with bi-functional PEG (~70%) compared to heterofunctional PEG (~95%), suggesting a greater coating density with hetero-functional PEG. The dotted curves show the TG graphs of the pure polymers before their conjugation to the NPs; on the other hand, the TG graphs of the coated NPs represent the total weight loss due to decomposition of the conjugated polymers, silanization molecules (TSP) and any oleic acid residue on the surface of the NPs. Note that the same polymer to NPs molar ratio was used for both types of the NPs presented here.
Fig. 2
Fig. 2
Multimodal imaging performance of the NPs at different concentrations: (a) and (b) MPS (dm/dH) graphs of the NPs as representatives of their MPI performance, (c) MRI R2 maps and (d) T2 relaxivity of the NPs, and (e) NIRF images of the NPs. The signal intensities in all these imaging modalities change linearly with NPs concentration, which is critical for determining the amount of the NPs in tissues.
Fig. 3
Fig. 3
m-H (a and d) and MPS dm/dH (b and e) graphs of the blood samples drawn retro-orbitally at different (0-60 min) post-injection times. Note that 0 min data correspond to a blood sample that was directly taken after NPs injection. (c) and (f) show the concentration of the NPs in blood samples calculated from m-H and dm/dH graphs. (a), (b) and (c) are the results of the blood analyses after injection of the NH2-PEG-NH2 modified NPs, and (d), (e) and (f) show the same results for the NH2-PEG-FMOC modified NPs. Red and black color graphs in (c) and (f) show the blood half-lives of the NPs determined by VSM and MPS data, respectively. We used the standard lines generated by NPs before the injections (Figs. 2a and S3) to determine the blood half-lives of the NPs from these blood MPS and VSM data. NPs coated with hetero-functional PEG (NH2-PEG-FMOC) showed a longer plasmatic circulation time (23-26 min) than NPs coated with bi-functional NH2-PEG-NH2 (12-14 min). All the VSM and MPS measurements were repeated three times and average graphs with standard deviations are presented here.
Fig. 4
Fig. 4
Tri-modal imaging of the blood samples drawn after injection of NIRF labeled NPs functionalized with NH2-PEG-NH2 and NH2-PEG-FMOC: (a) MPI, (b) MRI R2 map and (c) NIRF images. No signal was observed in blood samples without any NPs. The signal intensity in all the three imaging modalities depends on the concentration and pharmacokinetic of the NPs in the blood plasma. NPs coated with NH2-PEG-FMOC showed stronger post-injection signals in the blood in all these three imaging modalities.
Fig. 5
Fig. 5
Whole mouse body imaging 72 hours after injection of NPs functionalized with NH2-PEG-FMOC: (a) colorized MPI (b) NIRF and (c) MRI T2 weighted and colorized R2 images. These three imaging modalities show that injected NPs were accumulated in the principal RES organs (i.e. liver and spleen). MPI generates a positive contrast image directly originated form the superparamagnetic NPs without any background noise from surrounding diamagnetic tissues. The NIRF image generated from the tissue penetrating signals of the Cy5.5 molecules and the negative contrast T2-weighted MRI images confirm the MPI biodistribution observations. These complementary modalities can be used for more accurate targeted imaging of the organs (e.g. tumors) in future.
Fig. 6
Fig. 6
(a) R2 values calculated form the change of the T2 contrast of the organs in live mice used for calculation of the concentration of the NPs functionalized with NH2-PEGFMOC in each organ (b). Biodistribution of these NPs determined by (c) MPS and (d) IVIS NIRF scanning of the excised organs of the mice sacrificed 72 hours after injection of the NPs. MPS, NIRF and MRI results show a similar mice biodistribution pattern for the injected NPs. A major part of the NPs were accumulated in liver. The remaining fraction of the NPs was detected in spleen, without any signal in kidney, brain, heart and lungs.
Fig. 7
Fig. 7
Optical microscope images (left) of H & E stained liver (a) and spleen (b) sections (12μm thickness slices) in comparison with their NIRF images (right) obtained form an Odyssey fluorescence scanner. The NIRF images show that NPs were only entrapped in the red pulp and marginal zones of the spleen. An almost uniform distribution of the NPs was observed in liver.
Fig. 8
Fig. 8
Optical microscope images of the Prussian Blue (left) and H&E (right) stained tissue sections. The images were used for histological evaluation of the liver, spleen, kidney, heart, lung and brain 72 hours after injection of the NPs functionalized with NH2-PEG-FMOC. Comparison of these Prussian Blues stained sections with PBS-injected control tissues (Fig. S8a) confirm the results of Fig. 6, showing that the NPs were mostly accumulated in RES organs (liver and spleen). The typical H&E images of the tissue sections show that the NPs did not cause any abnormal toxicity-related feature in these organs 72 hours after injection.
Scheme 1
Scheme 1
Two different surface modifications of the NPs by formation of an amide bonding between the amine groups on the PEG backbone and carboxyl groups on the surface of the silanized NPs: (a) conjugation of the bi-functional (NH2-PEG-NH2) and (b) hetero-functional (NH2-PEG-FMOC) PEG molecules. (c) Potential inter-particle bridging of some fraction of nanoparticles when bi-functional PEG is used for coating in comparison with (d) individually dispersed NPs modified with hetero-functional PEG. (e) Conjugation of amine-reactive Cy5.5 NHS ester to amine-functionalized NPs.

References

    1. Krishnan KM. Biomedical Nanomagnetics: A Spin Through Possibilities in Imaging, Diagnostics, and Therapy. IEEE Transactions on Magnetics. 2010;46:2523–58. - PMC - PubMed
    1. Pablico-Lansigan MH, Situ SF, Samia ACS. Magnetic particle imaging: advancements and perspectives for real-time in vivo monitoring and image-guided therapy. Nanoscale. 2013;5:4040–55. - PubMed
    1. Weizenecker J, Gleich B, Rahmer J, Dahnke H, Borgert J. Three-dimensional real-time in vivo magnetic particle imaging. Physics in Medicine and Biology. 2009;54:L1–L10. - PubMed
    1. Goodwill PW, Saritas EU, Croft LR, Kim TN, Krishnan KM, Schaffer DV, et al. X-Space MPI: Magnetic Nanoparticles for Safe Medical Imaging. Advanced Materials. 2012;24:3870–7. - PubMed
    1. Gleich B, Weizenecker J. Tomographic imaging using the nonlinear response of magnetic particles. Nature. 2005;435:1214–7. - PubMed

Publication types