. 2015 Apr 16;58(2):203-15.
doi: 10.1016/j.molcel.2015.02.029. Epub 2015 Mar 26.

Intracellular crotonyl-CoA stimulates transcription through p300-catalyzed histone crotonylation

Affiliations

Intracellular crotonyl-CoA stimulates transcription through p300-catalyzed histone crotonylation

Benjamin R Sabari et al. Mol Cell. .

Erratum in

Abstract

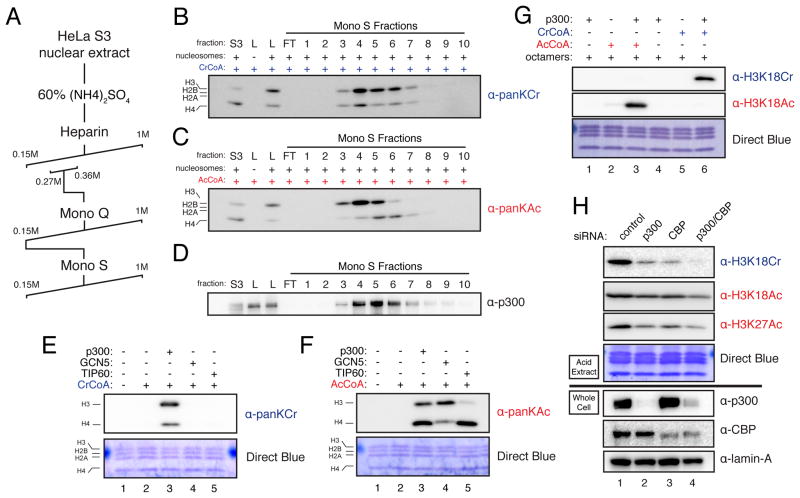
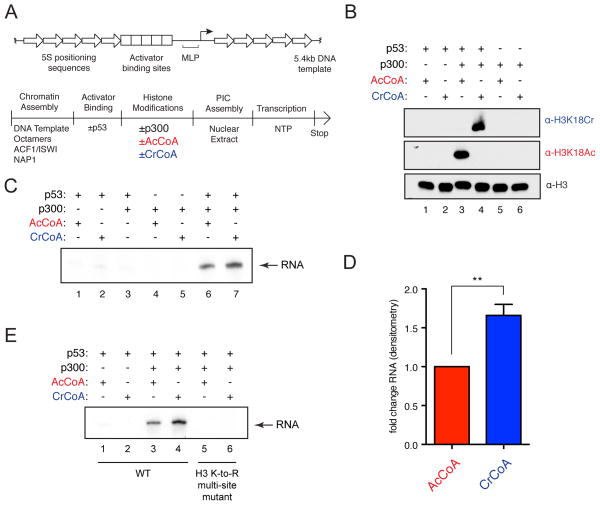
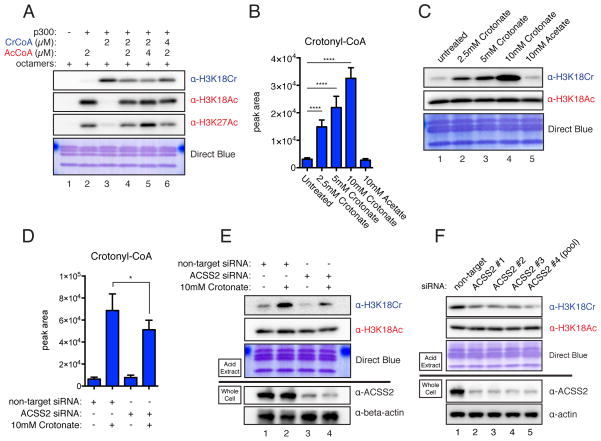
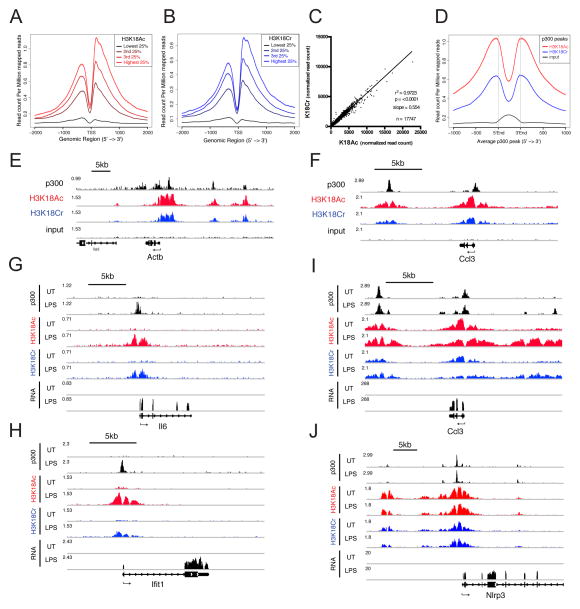
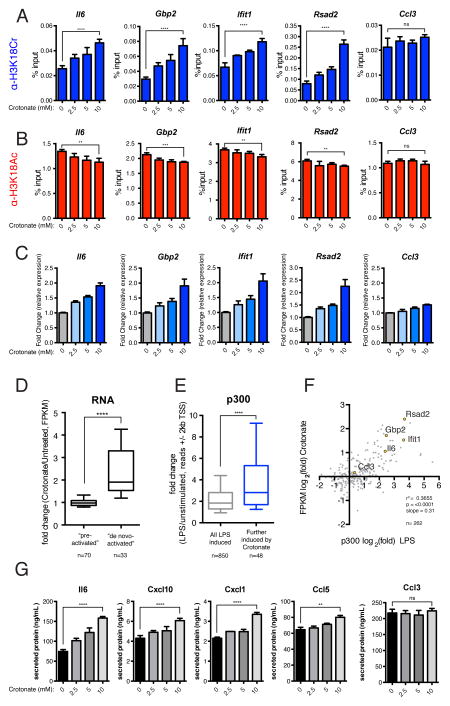
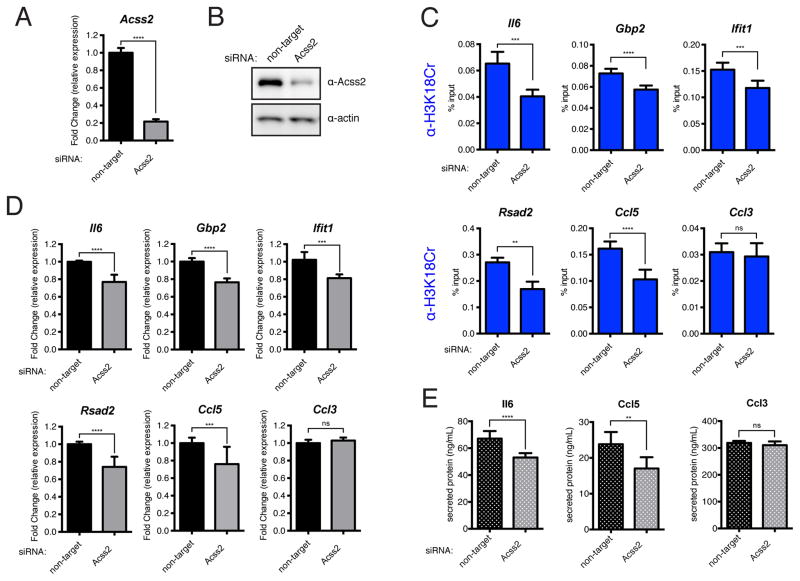
Acetylation of histones at DNA regulatory elements plays a critical role in transcriptional activation. Histones are also modified by other acyl moieties, including crotonyl, yet the mechanisms that govern acetylation versus crotonylation and the functional consequences of this "choice" remain unclear. We show that the coactivator p300 has both crotonyltransferase and acetyltransferase activities, and that p300-catalyzed histone crotonylation directly stimulates transcription to a greater degree than histone acetylation. Levels of histone crotonylation are regulated by the cellular concentration of crotonyl-CoA, which can be altered through genetic and environmental perturbations. In a cell-based model of transcriptional activation, increasing or decreasing the cellular concentration of crotonyl-CoA leads to enhanced or diminished gene expression, respectively, which correlates with the levels of histone crotonylation flanking the regulatory elements of activated genes. Our findings support a general principle wherein differential histone acylation (i.e., acetylation versus crotonylation) couples cellular metabolism to the regulation of gene expression.


Figures

Figure 1
Figure 1. p300 Co-Purifies With HCT Activity From Nuclear Extract and Has Intrinsic HCT Activity In Vitro and In Cells
(A) HCT partial purification scheme (B–C) HCT activity co-elutes with HAT activity. HeLa S3 nuclear extracts were fractionated by the scheme detailed in (A). HCT and HAT activities were assayed by panKCr or panKAc immunoblot, respectively, at each round of fractionation and peak HCT activity was followed. The immublot readouts for HCT (B) and HAT activity (C) of the final Mono S fractions are shown here. S3 indicates crude unfractionated extract, L indicates the load/Mono S input, and FT indicates the column flow through. Equal volumes of each fraction were used in these assays. For MS/MS analysis of fractions with peak HCT activity (fractions 4, 5, and 6) see Figure S1C–E and Table S1. (D) Immunoblot for p300 of the fractions assayed for activity in (B–C). Labels and loading are as in (B–C). (E–F) HCT (E) and HAT (F) activities of purified recombinant p300, GCN5, and TIP60 were assayed using recombinant octamers as substrate. Reaction products were immunoblotted with the indicated antibodies. (G) p300-mediated HCT and HAT reactions were performed as in (E–F) with the indicated reaction conditions. Reaction products were probed with the indicated site-specific antibodies. (H) HeLa S3 cells were transfected with control or p300- and/or CBP-specific siRNA. 72 hours post-transfection, whole cell lysates and histones were prepared and immunoblotted with the indicated antibodies. Immunoblots of acid extracts are shown above the black line, while immunoblots of whole cell lysates are shown below the black line. See also Figure S1.
Figure 2
Figure 2. Histone Crotonylation Stimulates Transcription In a Cell-Free System
(A) Schematic of the transcription template (top) and the transcription reaction order of addition (bottom). (B) p300 HAT and HCT reactions using recombinant chromatin with the indicated additions were analyzed by immunoblotting with the indicated antibodies. (C) Transcription assays were performed under the indicated conditions. RNA products were visualized by autoradiography. (D) Densitometry of autoradiographs comparing acetyl-CoA and crotonyl-CoA containing transcription reactions. Data represent mean fold change from three independent experiments ± standard deviation, p-value = 0.0013. (E) In vitro transcription assays using chromatin reconstituted with recombinant wild-type H3 or with lysine residues 9, 14, 18, 23, 27, 36, and 56 mutated to arginine (K-to-R). RNA products were visualized by autoradiography. See also Figure S2.
Figure 3
Figure 3. Histone Crotonylation is Regulated Metabolically by the Concentration of Crotonyl-CoA
(A) In vitro p300 HAT/HCT reactions were performed with indicated concentrations of crotonyl-CoA and acetyl-CoA. Reaction products were immunoblotted with the indicated antibodies. (B) LC-MS analysis of cellular crotonyl-CoA levels extracted from HeLa S3 cells cultured with the indicated concentration of sodium crotonate (pH 7.4) or sodium acetate (pH 7.4) added to full media for 12 hours. The data represent mean peak area ± standard deviation of four independent experiments. Summary of p-value is as follows: ns (p>0.05), * (p≤0.05), ** (p≤0.01), *** (p≤0.001), **** (p≤0.0001). (C) Histones were acid extracted from HeLa S3 cells treated as in (B) and immunoblotted by the indicated antibodies. (D) HeLa S3 cells were transfected with control or ACSS2-specific siRNA (pool of 5). 12 hours prior to harvest 10 mM crotonate was added to the media as indicated. 72 hours post-transfection cells were harvested and subject to LC-MS analysis as in (B). The data represent mean peak area ± standard deviation of four independent experiments. p-value summary as in (B). (E) Same as (D), except 72 hours post-transfection, histones and whole cell lysates were prepared, and immunoblotted with the indicated antibodies. Immunoblots of acid extracts are shown above the black line, while immunoblots of whole cell lysates are shown bellow the black line. (F) HeLa S3 cells were transfected with control or specific siRNAs to ACSS2. ACSS2 #1-3 are unique single RNAs, and ACSS2 #4 is the pool of 5 used in (D–E). Analysis and labeling as in (C) and (E). See also Figures S3 and S4.
Figure 4
Figure 4. H3K18Cr is Associated With Active Chromatin, Correlates with p300 Peaks, and is Induced at “De Novo-Activated” Regulatory Elements Upon LPS Stimulation
(A–B) All genes with FPKM >1 were split into 4 equal groups based on their expression levels calculated from RNA-seq of unstimulated RAW 264.7 cells. The average profile of H3K18Ac (A) and H3K18Cr (B) ChIP-seq data from unstimulated RAW 264.7 cells are plotted for each group at TSS +/− 2kb. (C) Correlation between H3K18Ac and H3K18Cr ChIP-seq read counts within all H3K18Cr peaks (17,747). Plotted as normalized read counts (read counts per million mapped reads). (D) Average profile of H3K18Ac, H3K18Cr, and input ChIP-seq data from unstimulated RAW 264.7 around all annotated p300 peaks from unstimulated macrophages. (E–F) Genome browser representation of normalized ChIP-seq reads for p300, H3K18Ac, H3K18Cr, and input from unstimulated macrophages at a “housekeeping” gene (Actb) (E) and a lineage specific constitutively expressed (“pre-activated”) gene (Ccl3) (F). Normalized to total mapped reads. The y-axis maximum is given at the far left of each track. Arrow below refseq gene track indicates directionality of transcription. (G–J) Genome browser representation of RNA-seq reads and ChIP-seq reads for p300, H3K18Ac, and H3K18Cr from unstimulated (UT) and 120′ LPS-stimulated (LPS) macrophages at two “de novo-activated” genes (Il6 and Ifit1) (G and H, respectively) and two “pre-activated” genes (Ccl3 and Nlrp3) (I and J). Data presented as in (E–F). See also Figure S5.
Figure 5
Figure 5. Increasing the Concentration of Crotonyl-CoA Prior to LPS Stimulation Leads to a Greater Induction of H3K18Cr at, and Enhanced Stimulation of, “De Novo-Activated” Inflammatory Genes Upon LPS Stimulation
(A) qPCR analysis of H3K18Cr ChIP products from RAW 264.7 cells pre-treated with the indicated concentration of sodium crotonate (pH 7.4) (mM) for 6 hours prior to a 2-hour LPS stimulation. Primers were designed for TSS-proximal ChIP-seq peaks of H3K18Ac and H3K18Cr (see Experimental Procedures). ChIP-qPCR results for four “de novo-activated” genes (Il6, Gbp2, Ifit1, and Rsad2) and one “pre-activated” gene (Ccl3) are shown. Data are represented as mean of % input ± standard deviation of technical replicates. Summary of p-value is as follows: ns (p>0.05), * (p≤0.05), ** (p≤0.01), *** (p≤0.001), **** (p≤0.0001). (B) Experiment and analysis are same as (A), except ChIP was performed with H3K18Ac antibody. (C) RT-qPCR analysis of LPS-stimulated (120′) RAW 264.7 cells pre-treated with the indicated concentration of sodium crotonate (pH 7.4) (mM). Relative expression is normalized to Gapdh. RT-qPCR data for the same set of genes as in (A–B). Data are represented as the mean fold-change in relative expression due to crotonate addition from three independent experiments ± standard deviation. (D) The fold changes in FPKM over LPS-stimulation due to crotonate pre-treatment, as measured by RNAseq, are represented as a box and whisker plot (10th – 90th percentile) for both “pre-activated” and “de novo-activated” genes. P-value summaries are as in (A). (E) Box and whisker plot representation (10th – 90th percentile) of the fold change in p300 read counts, due to LPS stimulation, +/− 2kb from the TSS of two sets of genes, (1) all LPS induced genes (fold change (FPKM) ≥2 upon LPS stimulation, n=850) and (2) a subset of (1) whose expression was further induced ≥2-fold due to pre-treatment with crotonate (n=48). P-value summaries are as in (A). (F) Scatter plot representation of all LPS-stimulated genes with annotated p300 peaks ± 500bp from TSS (n=262), where x = fold change in p300 read counts due to LPS, and y = fold change in expression (FPKM) over LPS-induction due to crotonate pre-treatment; both are plotted as log2 values. Four “de novo-activated” gene (Il6, Gbp2, Ifit1, and Rsad2) and one “pre-activated” gene (Ccl3) are highlighted in yellow. (G) Chemokine and cytokine protein abundance in supernatants from LPS-stimulated (16hr) RAW 264.7 cells pre-treated with the indicated concentration of sodium crotonate. Data for four “de novo-activated” chemo/cytokines (Il6, Cxcl10, Cxcl1, and Ccl5) and one “pre-activated” chemokine (Ccl3) are represented here as the mean of two independent experiments ± standard deviation. P-value summaries are as in (A). See also Figure S6.
Figure 6
Figure 6. Knockdown of ACSS2 Prior to LPS Stimulation Leads to a Decreased Induction of H3K18Cr at, and Decreased Stimulation of, “De Novo-Activated” Inflammatory Genes Upon LPS Stimulation
(A–B) RAW 264.7 cells were transfected with control or Acss2-specific siRNAs, 72 hours post-transfection cells were harvested for either RT-qPCR analysis (A) or immunoblot analysis (B) to assess knockdown efficiency. For (A) data is presented as mean fold change due to ACSS2 knockdown of technical replicates ± standard deviation. Summary of p-value is as follows: ns (p>0.05), * (p≤0.05), ** (p≤0.01), *** (p≤0.001), **** (p≤0.0001). (C) qPCR analysis of H3K18Cr ChIP products from LPS-stimulated (120′) RAW 264.7 cells that had been transfected with either control siRNA or siRNAs specific for Acss2 72 hours prior to stimulation. ChIP-qPCR results for five “de novo-activated” genes (Il6, Gbp2, Ifit1, Rsad2, and Ccl5) and one “pre-activated” gene (Ccl3) are shown here. Data are represented as mean of % input of technical replicates ± standard deviation. P-value summaries are as in (A). (D) RT-qPCR analysis of LPS-stimulated (120′) RAW 264.7 cells previously transfected with either control or Acss2-specific RNAs, as in (C). Relative expression is normalized to Gapdh. RT-qPCR data are shown for the same set of genes as in (C). Data are represented as the mean fold-change in relative expression due to Acss2 knockdown from three independent experiments ± standard deviation. P-value summaries are as in (A). (E) Chemokine and cytokine protein abundance in supernatants from LPS-stimulated (16hr) RAW 264.7 cells transfected with the indicated RNAs, as in (C). Data for two “de novo-activated” chemo/cytokines (Il6 and Ccl5) and one “pre-activated” chemokine (Ccl3) are represented here as the mean of two independent experiments ± standard deviation. P-value summaries are as in (A).
Figure 7
Figure 7. Enzymatic and Metabolic Regulation of Differential Histone Acylation
Schematic diagram of the pathways involved in the enzymatic and metabolic regulation of histone crotonylation and histone acetylation (differential acylation). The differential acylation state of chromatin is regulated by the relative concentrations of acetyl-CoA and crotonyl-CoA, which are synthesized through distinct metabolic pathways, diagramed here. Branches of the diagram that are still unknown are marked by question marks. The PDH (pyruvate dehydrogenase), ACSS2 (Acyl-CoA synthetase), and ACL (ATP Citrate Lyase) reactions occur in both the cytosol and nuclear compartments. We favor the model that DNA-sequence-specific transcription factors (TF) recruit p300/CBP to specific genomic loci where they will “translate” the nuclear/cytosolic acyl-CoA levels by differentially acylating histones, thereby facilitating transcription to varying degrees.

Comment in

References

    1. An W, Kim J, Roeder RG. Ordered cooperative functions of PRMT1, p300, and CARM1 in transcriptional activation by p53. Cell. 2004;117:735–748. - PubMed
    1. An W, Palhan VB, Karymov MA, Leuba SH, Roeder RG. Selective requirements for histone H3 and H4 N termini in p300-dependent transcriptional activation from chromatin. Molecular Cell. 2002;9:811–821. - PubMed
    1. Bhatt DM, Pandya-Jones A, Tong AJ, Barozzi I, Lissner MM, Natoli G, Black DL, Smale ST. Transcript Dynamics of Proinflammatory Genes Revealed by Sequence Analysis of Subcellular RNA Fractions. Cell. 2012;150:279–290. - PMC - PubMed
    1. Brownell JE, Zhou J, Ranalli T, Kobayashi R, Edmondson DG, Roth SY, Allis CD. Tetrahymena histone acetyltransferase A: a homolog to yeast Gcn5p linking histone acetylation to gene activation. Cell. 1996;84:843–851. - PubMed
    1. Carvalho PC, Hewel J, Barbosa VC, Yates JR. Identifying differences in protein expression levels by spectral counting and feature selection. Genet Mol Res. 2008;7:342–356. - PMC - PubMed

Publication types

MeSH terms

Associated data