. 2015 Mar 30:6:6660.
doi: 10.1038/ncomms7660.

HIV-1 capsids bind and exploit the kinesin-1 adaptor FEZ1 for inward movement to the nucleus

Affiliations

HIV-1 capsids bind and exploit the kinesin-1 adaptor FEZ1 for inward movement to the nucleus

Viacheslav Malikov et al. Nat Commun. .

Abstract

Intracellular transport of cargos, including many viruses, involves directed movement on microtubules mediated by motor proteins. Although a number of viruses bind motors of opposing directionality, how they associate with and control these motors to accomplish directed movement remains poorly understood. Here we show that human immunodeficiency virus type 1 (HIV-1) associates with the kinesin-1 adaptor protein, Fasiculation and Elongation Factor zeta 1 (FEZ1). RNAi-mediated FEZ1 depletion blocks early infection, with virus particles exhibiting bi-directional motility but no net movement to the nucleus. Furthermore, both dynein and kinesin-1 motors are required for HIV-1 trafficking to the nucleus. Finally, the ability of exogenously expressed FEZ1 to promote early HIV-1 infection requires binding to kinesin-1. Our findings demonstrate that opposing motors both contribute to early HIV-1 movement and identify the kinesin-1 adaptor, FEZ1 as a capsid-associated host regulator of this process usurped by HIV-1 to accomplish net inward movement towards the nucleus.


Conflict of interest statement

Competing financial interests

The authors declare no conflicts of interest associated with this work.

Figures

Figure 1
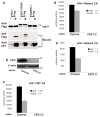
Figure 1. FEZ1 is a positive regulator of HIV-1 infection in non-neuronal human cells
(a) Endogenous levels of FEZ1 in neuroblastoma cells (Sh-SY5Y), microglia (CHME3) or primary normal human dermal fibroblasts (NHDF). Equal cell numbers were lysed and analyzed by WB using anti-FEZ1 antibody. Equal loading was confirmed using anti-GAPDH antibody. (b–i) FEZ1 is required for early HIV-1 infection regardless of the route of viral entry. NHDF (b–c), CHME3 (d–e) or Thp-1 differentiated into macrophages (f–g) were transfected with control siRNA (control) or independent FEZ1 siRNAs (FEZ1-B or FEZ1-C). 48h post-transfection cells were infected with HIV-1-VSV-luc followed by measurements of luciferase activity to determine levels of infection in NHDF (b), CHME3 (d) or differentiated Thp-1 (f) cells. (c, e and g) WB analysis showing the extent of FEZ1 depletion in samples from b, d and f, respectively. β-actin or eIF4E were used as loading controls. (h and i) Rescue of RNAi-mediated FEZ1 depletion restores HIV-1 infection. (h) Pools of NHDF cells expressing either Flag control or FEZ1-Flag were treated with either control or FEZ1-C siRNAs followed by HIV-1-VSV-luc infection and measurements of infectivity as in b–d. (i) WB analysis showing the levels of FEZ1 in samples from h. eIF4E was used as a loading control. (j and k) NHDF or CHME3 cells were transfected with control or FEZ1-C siRNAs followed by infection with HIV-1-Ampho-luc 48h post-transfection. Luciferase assays were used to determine levels of infection in NHDF (j) or CHME3 (k). Results are representative of 3 or more independent experiments, and error bars represent standard deviation. Molecular weight markers (in kDa) are shown to the right of WBs.
Figure 2
Figure 2. FEZ1 binds in vitro assembled HIV-1 CA-NC complexes and affects infection
(a) Binding of FEZ1 to in vitro assembled HIV-1 CA-NC complexes. 293T cells were transfected with plasmids expressing C-terminally flag-tagged FEZ1 (FEZ1-Flag), C-terminally flag-tagged CPSF6 (NES-CPSF6-Flag) or C-terminally flag-tagged SAMHD1 (SAMHD1-Flag). Cells were lysed 36h post-transfection and the lysates were incubated at room temperature for 1h with in vitro assembled HIV-1 CA-NC complexes. Samples were taken either before (Input) or after sedimentation through a 70% sucrose cushion (Bound) and analyzed by WB using anti-Flag and anti-p24 antibodies. (b–e) Effects of FEZ1 depletion on HIV-1 carrying WT or mutant caspids. NHDF cells were transfected with control siRNA or FEZ1 siRNA (FEZ1-C). 48h post-transfection cells were (b) lysed and analyzed by WB using antibodies to FEZ1 or β-actin (loading control) or (c–e) siRNA-transfected cells were infected with different dilutions of HIV-1-VSV-luc carrying a WT (p8.91) (c) N74D (d) and P90A (e) capsid. 48h post-infection luciferase activity was used to determine levels of infection. Results are representative of 3 or more independent experiments, and error bars represent standard deviation. Molecular weight markers (in kDa) are shown to the right of WBs.
Figure 3
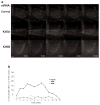
Figure 3. Depletion of FEZ1 inhibits HIV-1 trafficking to the nucleus
NHDFs were treated with control or FEZ1-C siRNAs. 48h post-transfection cells were infected with HIV-1-VSV-GFP-Vpr followed by live imaging using a spinning-disc confocal microscope. (a) Still images from movies (Supplementary Movies 1 and 2) taken at the indicated times are shown. Green arrows highlight viral particles entering and traversing the cytoplasm in control siRNA-treated cells. Red arrows highlight representative examples of particles that approach the nucleus but then move long distances back out to the cell periphery in FEZ1-depleted cells. (b) Quantification of the average distance (μm per 2.5 min) traveled by viral particles towards the nucleus (Retrograde motility) or away from the nucleus (Antrograde motility). n≥5 cells and an average of 7–30 viral particles per cell. (c) Quantification of the percentage of virions within 2μm of the nucleus in infected siRNA-treated cells at the indicated time points. n≥20 cells and an average of 80–99 viral particles per cell. (d–f) Depletion of FEZ1 affects HIV-1 particles that have productively fused into the cytoplasm. (d) NHDF cells were treated with control or FEZ1-C siRNAs. 48h after transfection cells were infected with HIV-1-VSV containing GFP-Vpr and S15-Tomato. 1h post-infection cells were fixed in formaldehyde and GFP and Tomato signals were acquired using a spinning-disc confocal microscope. Arrows highlight fused (green, S15-negative) particles proximal to the nucleus in each sample. Representative confocal planes are shown. (e) Quantification of the % fused (green, S15-negative) viral particles within 2μm of the nucleus in samples as described and processed in d. n≥29 cells and an average of 53–55 viral particles per cell. (f) Control siRNA-treated NHDF cells were treated with Bafilomycin A1 for 2h during spinoculation followed by infection with HIV-1-VSV containing GFP-Vpr and S15-Tomato. 1h post-infection cells were fixed and the total number of fused (green, S15-negative) viral particles were quantified and presented as a % of the total number of viral particles. n≥29 cells and an average of 55–80 viral particles per cell. Error bars represent standard deviation. Scale bars represent 10 μm.
Figure 4
Figure 4. Kinesin-1 regulates nuclear entry of HIV-1 DNA
(a–g) Kinesin-1 depletion affects early HIV-1 infection regardless of the route of viral entry. NHDF (a–b), CHME3 (c–d,g) or Jurkat (e–f) cells were transfected with control (ctrl), Kif5A or Kif5B siRNAs. 48h post-transfection cells were infected with HIV-1-VSV-luc (a, c, e) or HIV-1-Ampho-luc (g) followed by measurements of luciferase activity in NHDF (a), CHME3 (c, g) or Jurkat (e) cells. (b, d and f). WB analysis demonstrated kinesin-1 depletion in samples from a, c and e using antibodies against kinesin-1 (Kif5A/B), Kif5B or β-actin (loading control). (h) Kinesin-1 knockdown does not inhibit VSV infection. NHDF cells treated with control, Kif5A or Kif5B siRNAs were infected 48h post-transfection with VSV at m.o.i. 10. 8h after infection cells were lysed and analyzed by WB using anti-VSV-G or anti-VSV-N antibodies. eIF4E was used as loading control. (i) Effects of kinesin-1 depletion on fusion of HIV-1 cores into the cytosol. NHDFs were treated with control, Kif5A or Kif5B siRNAs and then either mock infected (upper panels) or infected with HIV-1-VSV-luc containing BlaM-Vpr (lower panels). FACS analysis of cells showed ~14–18% shift from green (uncleaved CCF2) to blue (cleaved CCF2) cells in control and kinesin-1-depleted cultures. (j–l) Kinesin-1 regulates nuclear entry of HIV-1 DNA. (j) CHME3 cells treated with control (Ctrl), Kif5A or Kif5B siRNAs were infected with HIV-1-VSV-puro 48h post-transfection. Low molecular Hirt DNA was isolated 24h post-infection and levels of viral MSS-DNA, total viral DNA and 2-LTRs in samples were measured by qPCR using specific primers to MSS, puromycin or 2-LTRs, respectively. Copy numbers were calculated and normalized to input DNA in each sample. Data are presented as mean +/- SEM. (k–l) CHME3 cells were transfected with plasmids expressing either GFP or GFP-tagged dominant negative Kif5B (Kif5B-GFP-DN). 48h post-transfection cells were infected (k) and levels of MSS DNA, total DN and 2-LTRs were measured as described in j. or (l) cells were lysed in Laemmli buffer and analyzed by WB using anti-GFP antibody to detect GFP or dominant-negative GFP-Kif5 (Kif5B-GFP-DN). Molecular weight markers (in kDa) are shown to the right of WBs.
Figure 5
Figure 5. Kinesin-1 depletion does not affect dynein, an inward motor required for HIV-1 infection
(a–b) Effects of kinesin-1 depletion on dynein levels and distribution. NHDF cells were treated with control siRNA (Ctrl) or siRNAs targeting Kif5A or Kif5B. 48h post-transfection cells were either lysed and analyzed by WB (a) or fixed and stained (b) using antibodies to kinesin-1 (Kif5A/B), Kif5B, dynein, trans-golgi network marker (TNG46) or β-actin. Molecular weight markers (in kDa) are shown to the right of WBs. Scale bars represent 10 μm. (c–e) Dynein is required for early HIV-1 infection. NHDF (c), CHME3 (d) or Jurkat (e) cells were treated with the indicated concentrations of the dynein inhibitor Ciliobrevin D for 30 min followed by HIV-1-VSV-luc infection in the presence of inhibitor. Luciferase activity was measured 48h post-infection to determine levels of infection. Error bars represent standard deviation from three independent experiments.
Figure 6
Figure 6. Depletion of kinesin-1 inhibits trafficking of HIV-1 particles to the nucleus
NHDFs were treated with control siRNA or siRNAs targeting either of two different isoforms of kinesin-1 heavy chain (Kif5A or Kif5B). 48h post-transfection cells were infected with HIV-1-VSV-GFP-Vpr followed by live imaging of particle movement. (a) Still images from movies (Supplementary Movies 5–7) at the indicated time points are shown. Scale bars represent 10 μm. (b) Quantification of the percentage of virions within 2μm of the nucleus in infected cells at the indicated time points. n≥15 cells and an average of 53–91 viral particles per cell. Results are representative of 3 or more independent experiments, and error bars represent standard deviation.
Figure 7
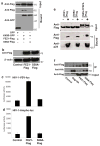
Figure 7. Binding to kinesin-1 is required for FEZ1 to promote early HIV-1 infection
(a) 293A cells were transfected with vectors expressing a control GFP or GFP-Kif5B tail along with either FEZ1-Flag or FEZ1-S58A-Flag (S58A-Flag) constructs. Soluble cell extracts were prepared 48h post-transfection, precleared and GFP proteins were recovered by incubating samples with GFP-binding protein (GBP) covalently coupled to Sepharose. Input and bound proteins were then analyzed by WB using anti-Flag and anti-GFP antibodies. (b) Pools of NHDF cells stably expressing Flag control (Control), full-length C-terminally flag-tagged FEZ1 (FEZ1-Flag) or a C-terminally flag-tagged FEZ1 mutant unable to bind kinesin-1 (S58A-Flag) were lysed and analyzed by WB using antibodies against Flag or β-actin (loading control). (c–d) NHDF pools described in b. were infected with HIV-1-VSV-luc (c) or HIV-1-Ampho-luc (d) followed by measurements of luciferase activity 48h post-infection to determine levels of infection. Results are representative of 3 or more independent experiments, and error bars represent standard deviation. (e) Binding of FEZ1 or FEZ1-S58A to in vitro assembled HIV-1 CA-NC complexes. 293T cells were transfected with FEZ1-Flag, FEZ1-S58A-Flag (S58a-Flag) or NES-CPSF6-Flag constructs as described in the legend for Fig. 2. Cells were lysed 36h post-transfection and the lysates were incubated at room temperature for 1h with in vitro assembled HIV-1 CA-NC complexes. The lysates were then analyzed by WB either before (Input) or after sedimentation through a 70% sucrose cushion (Bound) using anti-Flag and anti-p24 antibodies. (f) Binding of FEZ1-S58A to HIV-1 Gag by co-IP. 293A cells were co-transfected with a HA-tagged HIV-1 Gag expressing vector alone or together with FEZ1-Flag or FEZ1-S58A-Flag (S58A-Flag). Cells were lysed 48h post-transfection, and proteins were co-immunoprecipitated using anti-HA antibodies. Input and bound samples were then analyzed by WB either before (Input) or after immunoprecipitation (IP) using anti-Flag and anti-HA antibodies. Molecular weight markers (in kDa) are shown to the right of WBs.

References

    1. Welte MA. Bidirectional transport along microtubules. Curr Biol. 2004;14:R525–37. - PubMed
    1. Dodding MP, Way M. Coupling viruses to dynein and kinesin-1. Embo J. 2011;30:3527–39. - PMC - PubMed
    1. Fassati A. Multiple roles of the capsid protein in the early steps of HIV-1 infection. Virus Res. 2102;170:15–24. - PubMed
    1. McDonald D, et al. Visualization of the intracellular behavior of HIV in living cells. J Cell Biol. 2002;159:441–52. - PMC - PubMed
    1. Arhel N, et al. Quantitative four-dimensional tracking of cytoplasmic and nuclear HIV-1 complexes. Nat Methods. 2006;3:817–24. - PubMed

Publication types

LinkOut - more resources