

Status of autophagy, lysosome activity and apoptosis during corpus luteum regression in cattle
- PMID: 25819401
- PMCID: PMC4498366
- DOI: 10.1262/jrd.2014-135
Status of autophagy, lysosome activity and apoptosis during corpus luteum regression in cattle
Abstract
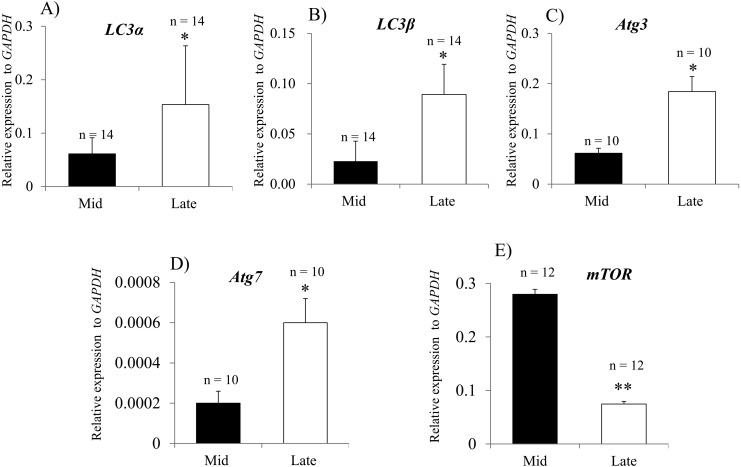
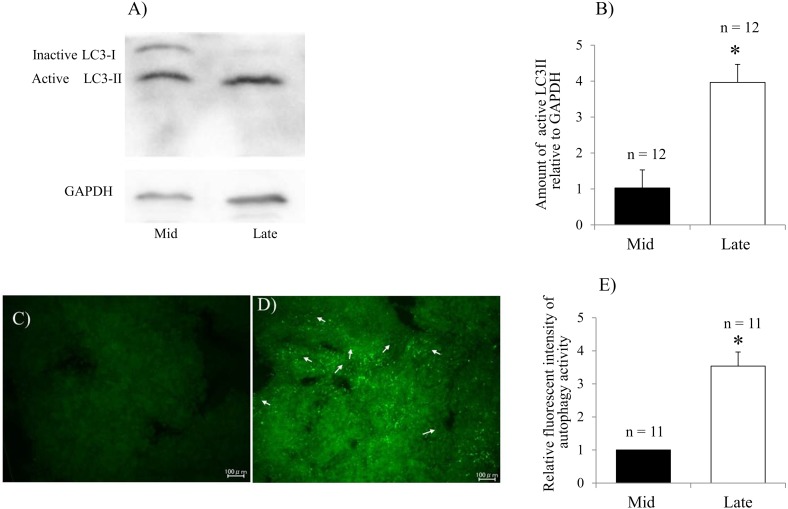
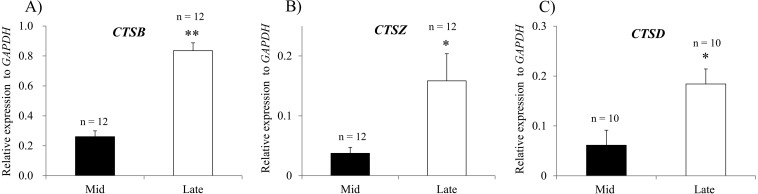
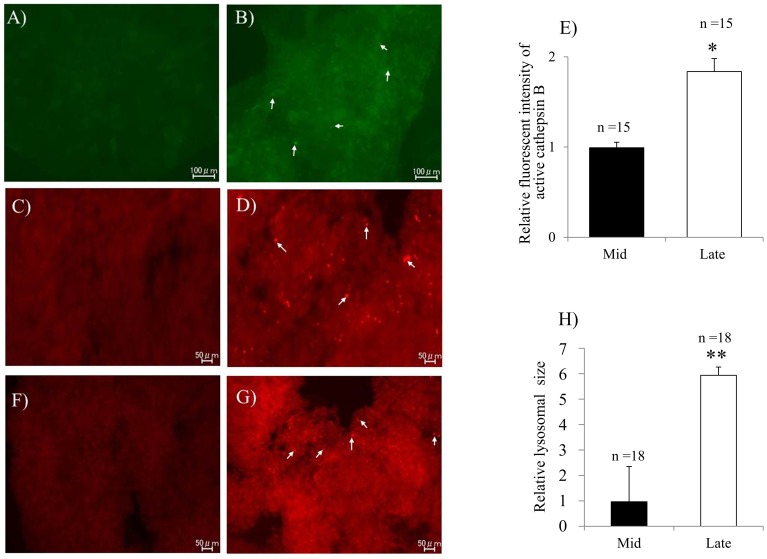
Corpus luteum (CL) regression is required during the estrous cycle. During CL regression, luteal cells stop producing progesterone and are degraded by apoptosis. However, the detailed mechanism of CL regression in cattle has not been fully elucidated. The aim of this study was to evaluate autophagy, lysosome activity, and apoptosis during CL regression in cattle. The expression of autophagy-related genes (LC3α, LC3β, Atg3, and Atg7) and the protein LC3-II was significantly higher in the late CL than in the mid CL. In addition, autophagy activity was significantly increased in the late CL. Moreover, gene expression of the autophagy inhibitor mammalian target of rapamycin (mTOR) was significantly lower in the late CL than in the mid CL. Lysosome activation and expression of cathepsin-related genes (CTSB, CTSD, and CTSZ) showed significant increases in the late CL and were associated with an increase in cathepsin B protein. In addition, mRNA expression and activity of caspase 3 (CASP3), an apoptotic enzyme, were significantly higher in the late CL than in the mid CL. These results suggest simultaneous upregulation of autophagy-related factors, lysosomal enzymes and apoptotic mediators, which are involved in regression of the bovine CL.
Figures
References
-
- Fields MJ, Fields PA. Morphological characteristics of the bovine corpus luteum during the estrous cycle and pregnancy. Theriogenology 1996; 45: 1295–1325. - PubMed
-
- Stocco C, Telleria C, Gibori G. The molecular control of corpus luteum formation, function, and regression. Endocr Rev 2007; 28: 117–149. - PubMed
-
- Ireland JJ, Mihm M, Austin E, Diskin MG, Roche JF. Historical perspective of turnover of dominant follicles during the bovine estrous cycle: key concepts, studies, advancements, and terms. J Dairy Sci 2000; 83: 1648–1658. - PubMed
-
- Juengel JL, Garverick HA, Johnson AL, Youngquist RS, Smith MF. Apoptosis during luteal regression in cattle. Endocrinology 1993; 132: 249–254. - PubMed
-
- Morales C, García-Pardo L, Reymundo C, Bellido C, Sánchez-Criado JE, Gaytán F. Different patterns of structural luteolysis in the human corpus luteum of menstruation. Hum Reprod 2000; 15: 2119–2128. - PubMed
Publication types
MeSH terms
Substances
LinkOut - more resources
Full Text Sources
Other Literature Sources
Research Materials
Miscellaneous