A novel risk score to predict cardiovascular disease risk in national populations (Globorisk): a pooled analysis of prospective cohorts and health examination surveys
- PMID: 25819778
- PMCID: PMC7615120
- DOI: 10.1016/S2213-8587(15)00081-9
A novel risk score to predict cardiovascular disease risk in national populations (Globorisk): a pooled analysis of prospective cohorts and health examination surveys
Abstract
Background: Treatment of cardiovascular risk factors based on disease risk depends on valid risk prediction equations. We aimed to develop, and apply in example countries, a risk prediction equation for cardiovascular disease (consisting here of coronary heart disease and stroke) that can be recalibrated and updated for application in different countries with routinely available information.
Methods: We used data from eight prospective cohort studies to estimate coefficients of the risk equation with proportional hazard regressions. The risk prediction equation included smoking, blood pressure, diabetes, and total cholesterol, and allowed the effects of sex and age on cardiovascular disease to vary between cohorts or countries. We developed risk equations for fatal cardiovascular disease and for fatal plus non-fatal cardiovascular disease. We validated the risk equations internally and also using data from three cohorts that were not used to create the equations. We then used the risk prediction equation and data from recent (2006 or later) national health surveys to estimate the proportion of the population at different levels of cardiovascular disease risk in 11 countries from different world regions (China, Czech Republic, Denmark, England, Iran, Japan, Malawi, Mexico, South Korea, Spain, and USA).
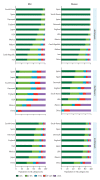
Findings: The risk score discriminated well in internal and external validations, with C statistics generally 70% or more. At any age and risk factor level, the estimated 10 year fatal cardiovascular disease risk varied substantially between countries. The prevalence of people at high risk of fatal cardiovascular disease was lowest in South Korea, Spain, and Denmark, where only 5-10% of men and women had more than a 10% risk, and 62-77% of men and 79-82% of women had less than a 3% risk. Conversely, the proportion of people at high risk of fatal cardiovascular disease was largest in China and Mexico. In China, 33% of men and 28% of women had a 10-year risk of fatal cardiovascular disease of 10% or more, whereas in Mexico, the prevalence of this high risk was 16% for men and 11% for women. The prevalence of less than a 3% risk was 37% for men and 42% for women in China, and 55% for men and 69% for women in Mexico.
Interpretation: We developed a cardiovascular disease risk equation that can be recalibrated for application in different countries with routinely available information. The estimated percentage of people at high risk of fatal cardiovascular disease was higher in low-income and middle-income countries than in high-income countries.
Funding: US National Institutes of Health, UK Medical Research Council, Wellcome Trust.
Copyright © 2015 Elsevier Ltd. All rights reserved.
Conflict of interest statement
Authors declare no conflicts of interest.
Figures


Comment in
-
New scoring system predicts cardiovascular disease risk worldwide.BMJ. 2015 Mar 26;350:h1670. doi: 10.1136/bmj.h1670. BMJ. 2015. PMID: 25813964 No abstract available.
-
Prediction of cardiovascular disease worldwide.Lancet Diabetes Endocrinol. 2015 May;3(5):309-10. doi: 10.1016/S2213-8587(15)00002-9. Epub 2015 Mar 26. Lancet Diabetes Endocrinol. 2015. PMID: 25819779 No abstract available.
References
-
- Jackson R, Lawes CM, Bennett DA, Milne RJ, Rodgers A. Treatment with drugs to lower blood pressure and blood cholesterol based on an individual’s absolute cardiovascular risk. Lancet. 2005;365(9457):434–41. - PubMed
-
- Joint British Societies’ consensus recommendations for the prevention of cardiovascular disease (JBS3) Heart. 2014;100(Suppl 2):ii1–ii67. - PubMed
-
- World Health Organization. Prevention of cardiovascular disease: guidelines for assessment and management of cardiovascular risk. Geneva: 2007.
-
- Stone NJ, Robinson J, Lichtenstein AH, Bairey Merz CN, Lloyd-Jones DM, Blum CB, et al. 2013 ACC/AHA Guideline on the Treatment of Blood Cholesterol to Reduce Atherosclerotic Cardiovascular Risk in Adults: A Report of the American College of Cardiology/American Heart Association Task Force on Practice Guidelines. J Am Coll Cardiol. 2013 - PubMed
-
- National Institute for Health and Care Excellence. Lipid modification: cardiovascular risk assessment and the modification of blood lipids for the primary and secondary prevention of cardiovascular disease. London: 2014. - PubMed
Publication types
MeSH terms
Grants and funding
- R01-HD38700/HD/NICHD NIH HHS/United States
- R01 HD030880/HD/NICHD NIH HHS/United States
- 1R01-DK090435/DK/NIDDK NIH HHS/United States
- MRC_/Medical Research Council/United Kingdom
- 100693/WT_/Wellcome Trust/United Kingdom
- R01 DK090435/DK/NIDDK NIH HHS/United States
- P30 DK056350/DK/NIDDK NIH HHS/United States
- DK056350/DK/NIDDK NIH HHS/United States
- R24 HD050924/HD/NICHD NIH HHS/United States
- 001/WHO_/World Health Organization/International
- R01 HD038700/HD/NICHD NIH HHS/United States
- 101506/WT_/Wellcome Trust/United Kingdom
- R01-HD30880/HD/NICHD NIH HHS/United States
- 5 R24 HD050924/HD/NICHD NIH HHS/United States
LinkOut - more resources
Full Text Sources
Medical

