

Lincomycin at Subinhibitory Concentrations Potentiates Secondary Metabolite Production by Streptomyces spp
- PMID: 25819962
- PMCID: PMC4421039
- DOI: 10.1128/AEM.04214-14
Lincomycin at Subinhibitory Concentrations Potentiates Secondary Metabolite Production by Streptomyces spp
Abstract
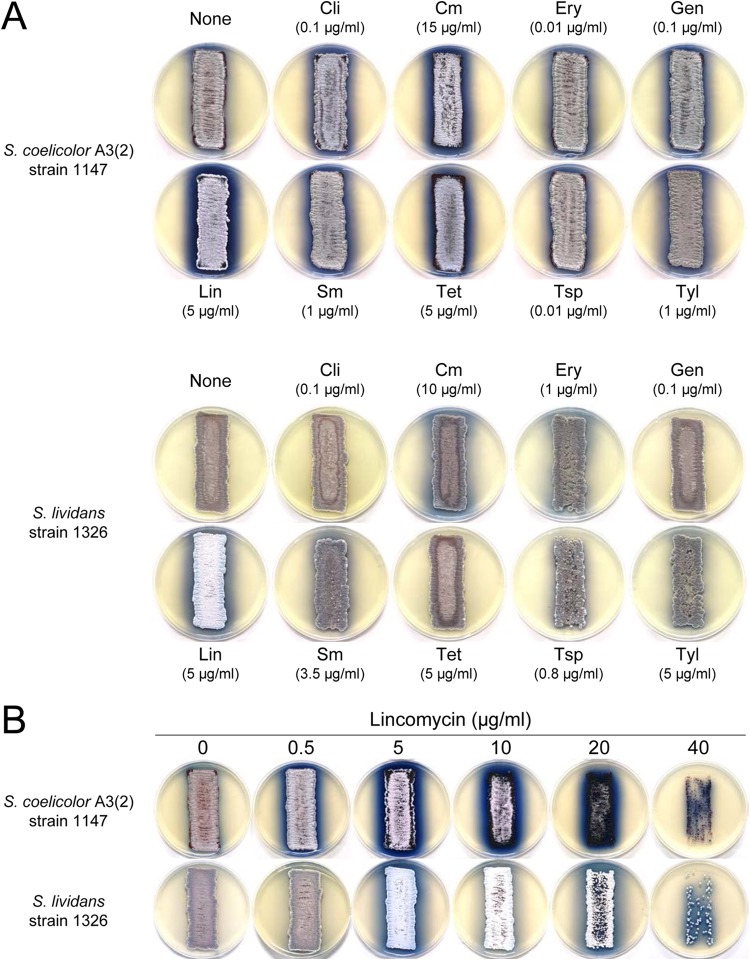
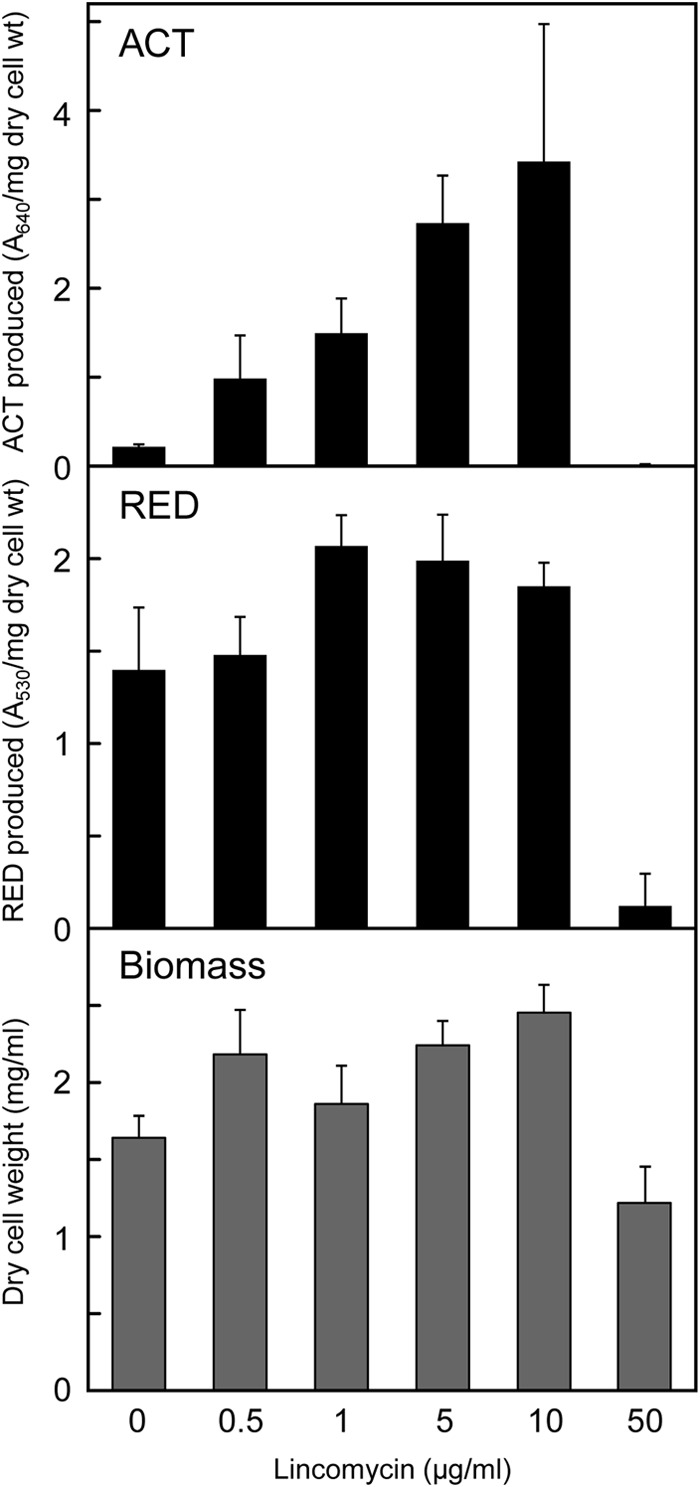
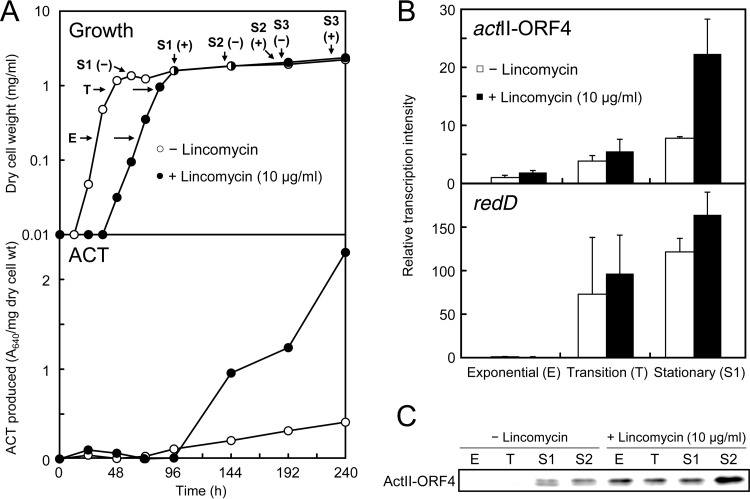
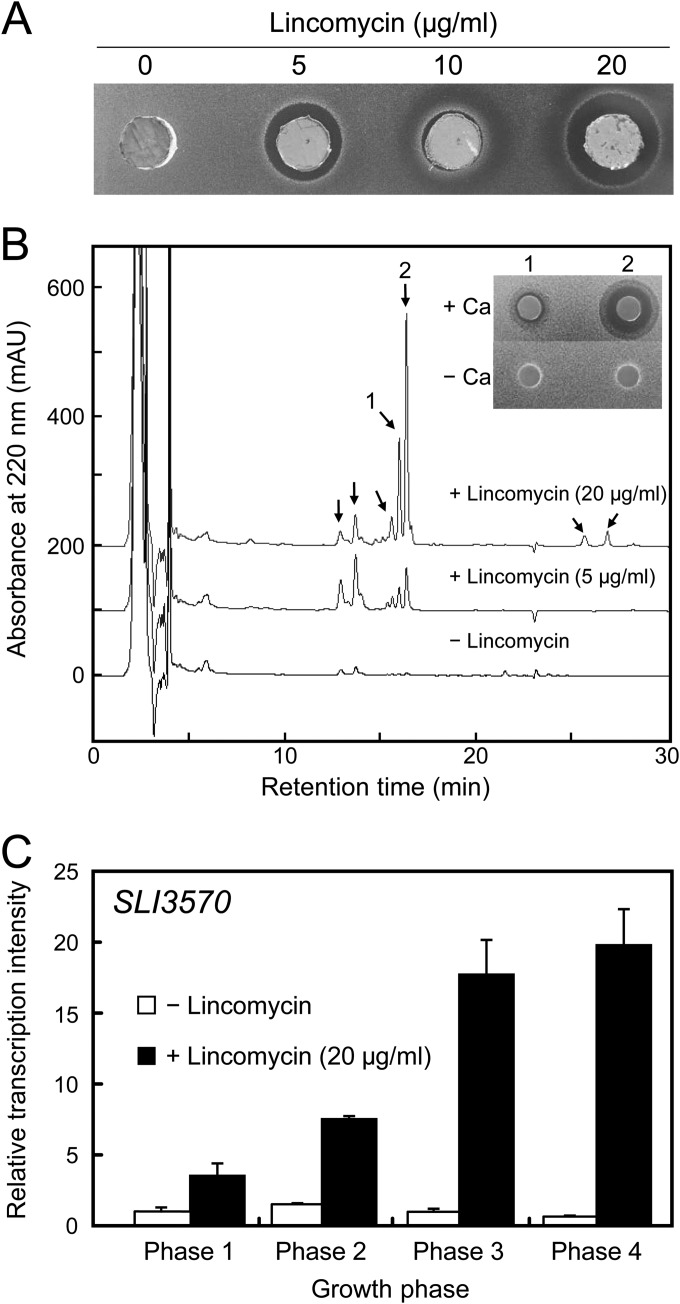
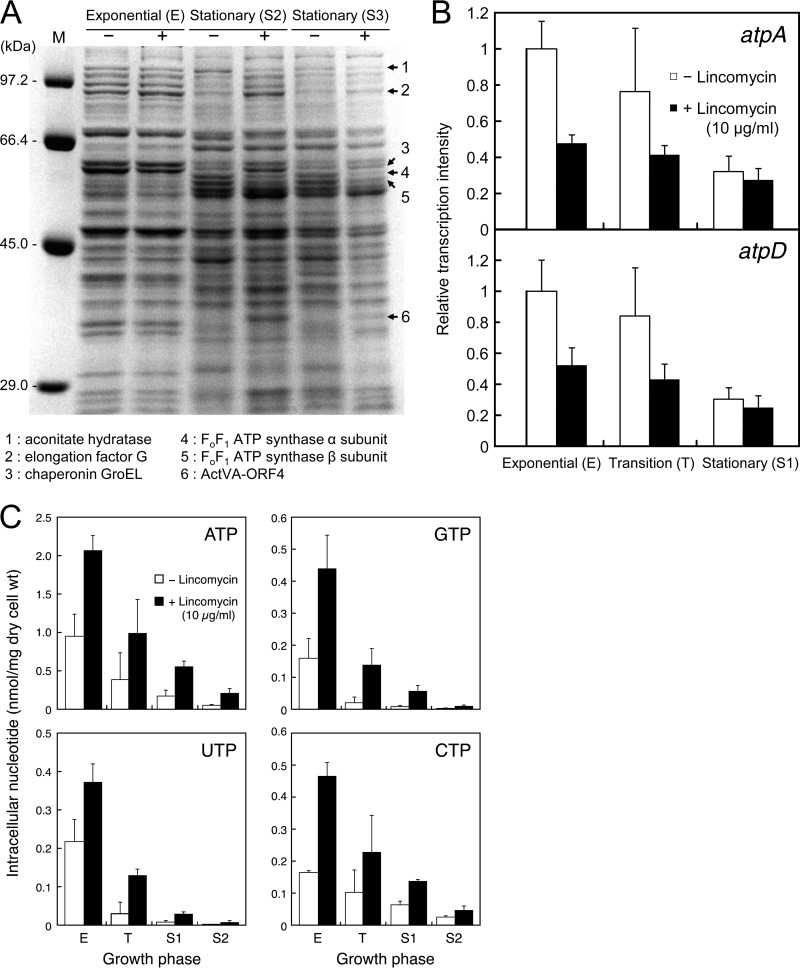
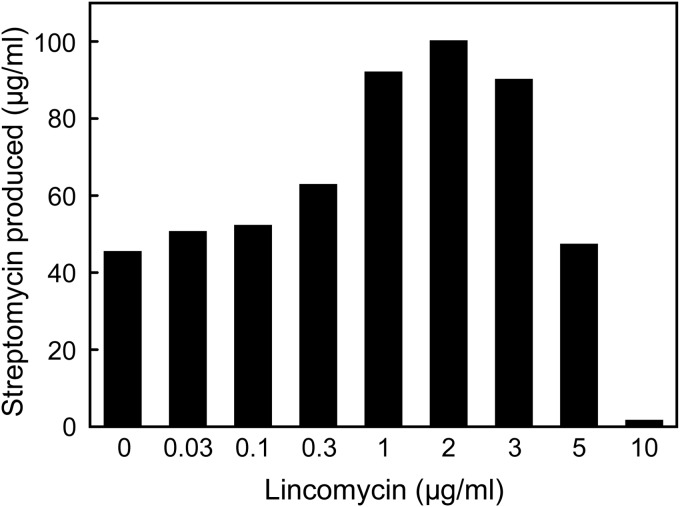
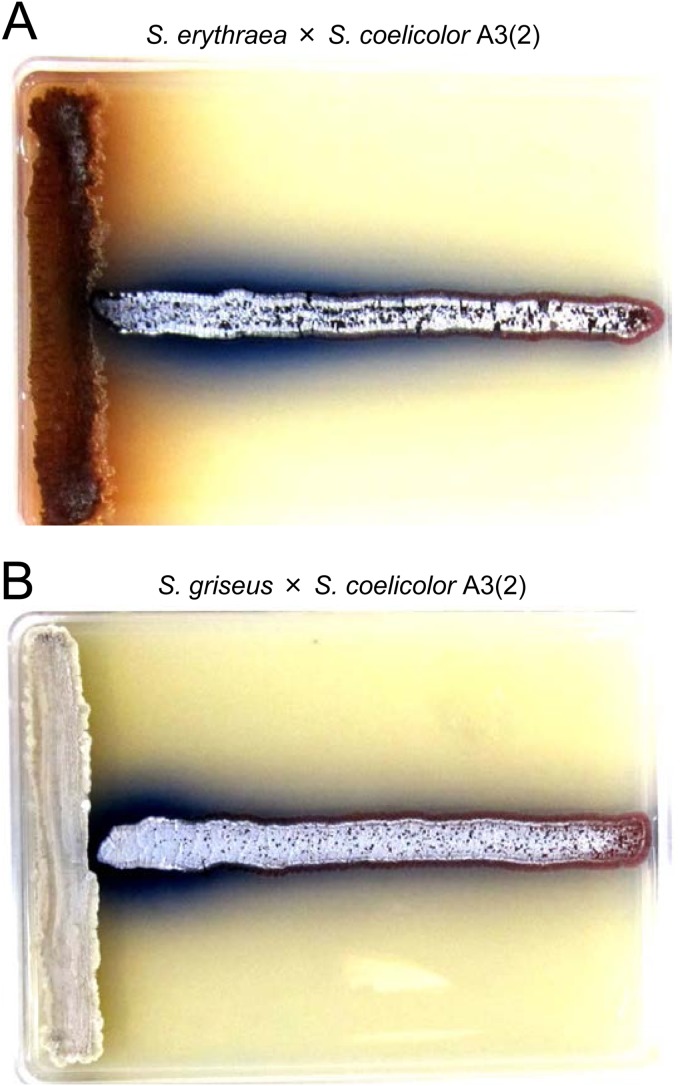
Antibiotics have either bactericidal or bacteriostatic activity. However, they also induce considerable gene expression in bacteria when used at subinhibitory concentrations (below the MIC). We found that lincomycin, which inhibits protein synthesis by binding to the ribosomes of Gram-positive bacteria, was effective for inducing the expression of genes involved in secondary metabolism in Streptomyces strains when added to medium at subinhibitory concentrations. In Streptomyces coelicolor A3(2), lincomycin at 1/10 of its MIC markedly increased the expression of the pathway-specific regulatory gene actII-ORF4 in the blue-pigmented antibiotic actinorhodin (ACT) biosynthetic gene cluster, which resulted in ACT overproduction. Intriguingly, S. lividans 1326 grown in the presence of lincomycin at a subinhibitory concentration (1/12 or 1/3 of its MIC) produced abundant antibacterial compounds that were not detected in cells grown in lincomycin-free medium. Bioassay and mass spectrometry analysis revealed that some antibacterial compounds were novel congeners of calcium-dependent antibiotics. Our results indicate that lincomycin at subinhibitory concentrations potentiates the production of secondary metabolites in Streptomyces strains and suggest that activating these strains by utilizing the dose-response effects of lincomycin could be used to effectively induce the production of cryptic secondary metabolites. In addition to these findings, we also report that lincomycin used at concentrations for markedly increased ACT production resulted in alteration of the cytoplasmic protein (FoF1 ATP synthase α and β subunits, etc.) profile and increased intracellular ATP levels. A fundamental mechanism for these unique phenomena is also discussed.
Copyright © 2015, American Society for Microbiology. All Rights Reserved.
Figures
Similar articles
-
A possible mechanism for lincomycin induction of secondary metabolism in Streptomyces coelicolor A3(2).Antonie Van Leeuwenhoek. 2018 May;111(5):705-716. doi: 10.1007/s10482-018-1021-0. Epub 2018 Jan 25. Antonie Van Leeuwenhoek. 2018. PMID: 29372424
-
Lincomycin-Induced Secondary Metabolism in Streptomyces lividans 66 with a Mutation in the Gene Encoding the RNA Polymerase Beta Subunit.Curr Microbiol. 2020 Oct;77(10):2933-2939. doi: 10.1007/s00284-020-02126-9. Epub 2020 Jul 17. Curr Microbiol. 2020. PMID: 32681314
-
Phenomenological interpretations of the mechanism for the concentration-dependent positive effect of antibiotic lincomycin on Streptomyces coelicolor A3(2).Appl Environ Microbiol. 2023 Oct 31;89(10):e0113323. doi: 10.1128/aem.01133-23. Epub 2023 Sep 21. Appl Environ Microbiol. 2023. PMID: 37732750 Free PMC article.
-
Lincosamides: chemical structure, biosynthesis, mechanism of action, resistance, and applications.Adv Appl Microbiol. 2004;56:121-54. doi: 10.1016/S0065-2164(04)56004-5. Adv Appl Microbiol. 2004. PMID: 15566978 Review. No abstract available.
-
Interplay between carbon, nitrogen and phosphate utilization in the control of secondary metabolite production in Streptomyces.Antonie Van Leeuwenhoek. 2018 May;111(5):761-781. doi: 10.1007/s10482-018-1073-1. Epub 2018 Mar 31. Antonie Van Leeuwenhoek. 2018. PMID: 29605896 Review.
Cited by
-
The Hormetic Effect Observed for Benzalkonium Chloride and Didecyldimethylammonium Chloride in Serratia sp. HRI.Microorganisms. 2023 Feb 23;11(3):564. doi: 10.3390/microorganisms11030564. Microorganisms. 2023. PMID: 36985138 Free PMC article.
-
Chemical Elicitors of Antibiotic Biosynthesis in Actinomycetes.Microorganisms. 2018 Jun 8;6(2):52. doi: 10.3390/microorganisms6020052. Microorganisms. 2018. PMID: 29890642 Free PMC article. Review.
-
Enhancing chemical and biological diversity by co-cultivation.Front Microbiol. 2023 Feb 1;14:1117559. doi: 10.3389/fmicb.2023.1117559. eCollection 2023. Front Microbiol. 2023. PMID: 36819067 Free PMC article. Review.
-
A Natural Product Chemist's Guide to Unlocking Silent Biosynthetic Gene Clusters.Annu Rev Biochem. 2021 Jun 20;90:763-788. doi: 10.1146/annurev-biochem-081420-102432. Epub 2021 Apr 13. Annu Rev Biochem. 2021. PMID: 33848426 Free PMC article. Review.
-
Symbiosis-inspired approaches to antibiotic discovery.Nat Prod Rep. 2017 Jul 6;34(7):784-814. doi: 10.1039/c7np00009j. Nat Prod Rep. 2017. PMID: 28561849 Free PMC article. Review.
References
-
- Kieser T, Bibb MJ, Buttner MJ, Chater KF, Hopwood DA. 2000. Practical Streptomyces genetics. The John Innes Foundation, Norwich, United Kingdom.
-
- Bentley SD, Chater KF, Cerdeno-Tarraga AM, Challis GL, Thomson NR, James KD, Harris DE, Quail H, Kieser D, Harper D, Bateman A, Brown S, Chandra G, Chen CW, Collins M, Cronin A, Fraser A, Goble A, Hidalgo J, Hornsby T, Howarth S, Huang CH, Kieser T, Larke L, Murphy L, Oliver K, O'Neil S, Rabbinowitsch E, Rajandream MA, Rutherford K, Rutter S, Seeger K, Saunders D, Sharp S, Squares R, Squares S, Taylor K, Warren T, Wietzorrek A, Woodward J, Barrell BG, Parkhill J, Hopwood DA. 2002. Complete genome sequence of the model actinomycete Streptomyces coelicolor A3(2). Nature 417:141–147. doi:10.1038/417141a. - DOI - PubMed
Publication types
MeSH terms
Substances
LinkOut - more resources
Full Text Sources
Other Literature Sources
Medical
Molecular Biology Databases
Miscellaneous
