. 2015 Mar 27;4(4):e001868.
doi: 10.1161/JAHA.115.001868.

Matrix metalloproteinase-2 negatively regulates cardiac secreted phospholipase A2 to modulate inflammation and fever

Affiliations

Matrix metalloproteinase-2 negatively regulates cardiac secreted phospholipase A2 to modulate inflammation and fever

Evan Berry et al. J Am Heart Assoc. .

Abstract

Background: Matrix metalloproteinase (MMP)-2 deficiency makes humans and mice susceptible to inflammation. Here, we reveal an MMP-2-mediated mechanism that modulates the inflammatory response via secretory phospholipase A2 (sPLA2), a phospholipid hydrolase that releases fatty acids, including precursors of eicosanoids.

Methods and results: Mmp2(-/-) (and, to a lesser extent, Mmp7(-/-) and Mmp9(-/-)) mice had between 10- and 1000-fold elevated sPLA2 activity in plasma and heart, increased eicosanoids and inflammatory markers (both in the liver and heart), and exacerbated lipopolysaccharide-induced fever, all of which were blunted by adenovirus-mediated MMP-2 overexpression and varespladib (pharmacological sPLA2 inhibitor). Moreover, Mmp2 deficiency caused sPLA2-mediated dysregulation of cardiac lipid metabolic gene expression. Compared with liver, kidney, and skeletal muscle, the heart was the single major source of the Ca(2+)-dependent, ≈20-kDa, varespladib-inhibitable sPLA2 that circulates when MMP-2 is deficient. PLA2G5, which is a major cardiac sPLA2 isoform, was proinflammatory when Mmp2 was deficient. Treatment of wild-type (Mmp2(+/+)) mice with doxycycline (to inhibit MMP-2) recapitulated the Mmp2(-/-) phenotype of increased cardiac sPLA2 activity, prostaglandin E2 levels, and inflammatory gene expression. Treatment with either indomethacin (to inhibit cyclooxygenase-dependent eicosanoid production) or varespladib (which inhibited eicosanoid production) triggered acute hypertension in Mmp2(-/-) mice, revealing their reliance on eicosanoids for blood pressure homeostasis.

Conclusions: A heart-centric MMP-2/sPLA2 axis may modulate blood pressure homeostasis, inflammatory and metabolic gene expression, and the severity of fever. This discovery helps researchers to understand the cardiovascular and systemic effects of MMP-2 inhibitors and suggests a disease mechanism for human MMP-2 gene deficiency.

Keywords: PLA2; heart; inflammation; matrix metalloproteinases.


Figures

Figure 1.
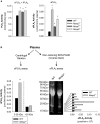
Figure 1.
MMP‐2 is a negative regulator of phospholipase A2 activity. A, Enzymatic activities of phospholipase A2. Left: cPLA2 and iPLA2 activity from mouse liver. Right: sPLA2 activity from mouse plasma. The activity of pools of n=4 mice per genotype was measured in duplicate. *P≤0.05 vs WT. All pairwise multiple‐comparison procedures (Holm–Sidak method). B, Left: sPLA2 activity in plasma samples (pools of n=3 mice per genotype) fractionated by weight using centrifugal filters and measured in duplicate. *P≤0.05 vs WT (3 to 30 kDa). All pairwise multiple‐comparison procedures (Holm–Sidak method). Right: Fractionation by molecular weight (nonreducing SDS‐PAGE) of sPLA2 activity in pooled plasma samples (pools of n=3 mice per genotype). After reverse staining (used to visualize plasma protein bands without affecting enzyme activity), protein was eluted from the gel and assessed for sPLA2 activity (vertical bar diagram). cPLA2 indicates cytosolic phospholipase A2; iPLA2, calcium‐independent phospholipase A2; MMP, matrix metalloproteinase; sPLA2, secreted phospholipase A2; WT, wild‐type.
Figure 2.
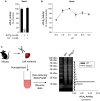
Figure 2.
A, Effect of different nutritional regimens on plasma sPLA2 activity. The activity in pools of n=4 (for chow‐fed and 2.5‐day 0.15% cholesterol–fed mice) or n=3 (for fasted‐refed mice and 4‐week 2% cholesterol–fed mice) was measured in duplicate. *P≤0.05 vs WT, t test. B, Effect of diet on hepatic MMP‐2 expression. Gelatin zymography indicating hepatic MMP‐2 activity levels of WT mice that were fed, fasted, fasted‐refed, or cholesterol fed. Pools of n=5 for fasted mice, n=4 for fed, fasted‐refed, and cholesterol‐fed mice. MMP indicates matrix metalloproteinase; sPLA2, secreted phospholipase A2; WT, wild‐type.
Figure 3.
Figure 3.
MMP‐2 is a negative regulator of eicosanoid synthesis. A, Hepatic PGE2 concentration in mice. Pools of n=4 for each genotype were measured in duplicate. *P≤0.05 vs WT (control). Multiple comparisons vs control group (Holm–Sidak method). B, Plasma free 8‐isoprostane concentration in mice. Pools of n=4 for each genotype were measured in duplicate. *P≤0.05 vs WT, t test. C, WT mice were administered the sPLA2 inhibitor varespladib (10 mg/kg per day) for 2 days. Left: Plasma sPLA2 activity. Right: Hepatic PGE2 concentration. Pools of n=3 for each treatment group were measured in duplicate. *P≤0.05 vs WT−Varespladib (control). P≤0.05 vs Mmp2−/−−Varespladib (control). All pairwise multiple‐comparison procedures (Holm–Sidak method). MMP indicates matrix metalloproteinase; PGE2, prostaglandin E2; sPLA2, secreted phospholipase A2; WT, wild‐type.
Figure 4.
Figure 4.
Upregulation of sPLA2 activity by pharmacological MMP‐2 inhibition and downregulation by adenoviral MMP‐2 reconstitution. A, WT mice were orally administered 130 μL of 50 mg/kg per day doxycycline for 3 days (150 mg/kg doxycycline‐days, n=4) or 300 mg/kg per day doxycycline for 5 days (1500 mg/kg doxycycline‐days, n=4). Control mice received water (130 μL) by gavage for either 3 or 5 days (0 doxycycline‐days) and were pooled into a single group of n=7 mice for analysis. Left: Plasma sPLA2 activity. Right: Hepatic PGE2 concentration. Pooled samples of each treatment group were measured in duplicate. *P≤0.05 vs 0 doxycycline‐days (control). All pairwise multiple comparisons vs control group (Holm–Sidak method). B, Plasma sPLA2 activity was decreased by overexpression of human MMP‐2 with an adenoviral construct in WT and Mmp2−/− mice. Analysis of plasma sPLA2 activity in mice transduced with either AdMMP‐2 or AdGFP (≈108 pfu). The data presented corresponds to WT mice sacrificed 2 weeks after intravenous adenoviral injection and Mmp2−/− mice sacrificed 5 days after intraperitoneal adenoviral injection. n=4 mice per genotype. P≤0.05 vs AdGFP, t test. AdGFP indicates green fluorescent protein–expressing adenovirus; AdMMP, MMP‐2‐encoding adenovirus; MMP, matrix metalloproteinase; PGE2, prostaglandin E2; sPLA2, secreted phospholipase A2; WT, wild‐type.
Figure 5.
Figure 5.
A, Analysis by qRT‐PCR of hepatic levels of human and mouse MMP‐2 level. B, Left: Analysis by gelatin zymography of MMP‐2 levels in plasma, heart, and liver. Right: Analysis by qRT‐PCR of human MMP2 expression in heart and liver. Mice were intraperitoneally injected with AdMMP‐2 or AdGFP (≈108 pfu). The data corresponds to Mmp2−/− mice sacrificed 5 days after adenoviral injection. n=4 mice for each genotype. AdGFP indicates green fluorescent protein–expressing adenovirus; AdMMP, MMP‐2–encoding adenovirus; MMP, matrix metalloproteinase; ND, not detected; qRT‐PCR, quantitative real‐time polymerase chain reaction; rhMMP‐2, recombinant human MMP‐2.
Figure 6.
Figure 6.
MMP‐2 modulates the transcription of inflammatory genes in the liver and heart at baseline and in response to LPS. qRT‐PCR analysis of inflammatory marker genes in the liver and heart of WT and Mmp2−/− mice. Effect of LPS treatment (30 μg/kg) for 5 hours. n=3 mice per genotype. *P≤0.05 vs WT−LPS (control). P≤0.05 vs Mmp2−/−−LPS (control). All pairwise multiple comparisons vs control group (Holm–Sidak method). LPS indicates lipopolysaccharide; MMP, matrix metalloproteinase; ND, not detected; qRT‐PCR, quantitative real‐time polymerase chain reaction; WT, wild‐type.
Figure 7.
Figure 7.
MMP‐2 modulates the expression of inflammatory cytokines in the heart at baseline and in response to LPS. Numerous cytokines are upregulated in Mmp2/ mice at baseline and 5 hours after LPS (30 μg/kg) administration (vs WT mice). The panel of selected cytokines was measured using the cytokine 32‐plex assay (Eve Technologies) in WT and Mmp2−/− hearts. n=4 mice per genotype. Pools of each treatment group were measured in duplicate. *P≤0.05 vs WT−LPS (control). P≤0.05 vs WT+LPS (control). P≤0.05 vs Mmp2−/−−LPS (control). All pairwise multiple comparisons vs control group (Holm–Sidak method). G‐CSF indicates granulocyte colony‐stimulating factor; IL, interleukin; INF, interferon; IP, Interferon gamma‐induced protein; LIX, lipopolysaccharide‐induced CXC chemokine; LPS, lipopolysaccharide; MCP, monocyte‐chemoattractant protein; MIG, monokine induced by gamma interferon; MMP, matrix metalloproteinase; ND, not detected; TNF, tumor necrosis factor; VEGF; vascular endothelial growth factor; WT, wild‐type.
Figure 8.
Figure 8.
MMP‐2 is a negative regulator of fever. A, Body temperature was measured rectally in WT and Mmp2−/− mice before and after intraperitoneal injection of LPS (30 μg/kg) at the indicated times. n=3 mice per genotype. *P≤0.05 vs Time=0 minute. One‐way repeated‐measures ANOVA. §P≤0.05 vs WT. All pairwise multiple‐comparison procedures (Holm–Sidak method). B, Plasma sPLA2 activity in untreated mice or LPS (30 μg/kg)‐treated mice 5 hours after LPS administration. Pools of n=3 were measured in duplicate. *P≤0.05 vs WT−LPS, t test. P≤0.05 vs Mmp2−/−−LPS, t test. C, Hypothalamic PGE2 levels in untreated mice or LPS (30 μg/kg) treated mice 5 hours after LPS administration. Pools of n=3 were measured in duplicate. *P≤0.05 vs WT−LPS, t test. P≤0.05 vs Mmp2−/−−LPS, t test. D, Body temperature was measured rectally in WT and Mmp2−/− mice before and after intraperitoneal injection of LPS (100 μg/kg) at the indicated times. n=3 mice per genotype. Selective blockade of LPS‐induced fever in Mmp2−/− (but not WT) mice by the pan‐sPLA2 inhibitor varespladib. Mice received varespladib (10 mg/kg per day) orally for 2 days, with the second dose immediately preceding intraperitoneal injection of LPS. *P≤0.05 vs Time=0 minute. One way repeated measures ANOVA. §P≤0.05 vs Mmp2−/−−Varespladib. All pairwise multiple‐comparison procedures (Student‐Newman‐Keuls method). ANOVA indicates analysis of variance; LPS, lipopolysaccharide; MMP, matrix metalloproteinase; PGE2, prostaglandin E2; sPLA2, secreted phospholipase A2; WT, wild‐type.
Figure 9.
Figure 9.
The heart is a major source of sPLA2 activity. sPLA2 activity in the heart, plasma, and liver against the sPLA2 substrates diheptanoyl thio‐PC and arachidonoyl thio‐PC. Pools of n=3 mice per genotype were measured in duplicate. *P≤0.05 vs WT, t test. ND indicates not detected; sPLA2, secreted phospholipase A2; WT, wild‐type.
Figure 10.
Figure 10.
Biochemical characteristics of the sPLA2 elevated in Mmp2 deficiency. A, Cardiac sPLA2 requires Ca++ for activity. The sPLA2 activity in Mmp2−/− heart homogenate was measured in the presence of EGTA (to chelate calcium) or an excess of calcium. Pools of n=3 were measured in duplicate. Similar results were obtained in 3 separate experiments. B, Cardiac sPLA2 has a broad pH optimum in the basic pH range. The sPLA2 activity of Mmp2−/− mouse heart homogenate (pool of n=3 mice) was measured at the indicated pH values in duplicate. Similar results were obtained in 3 separate experiments. C, Molecular weight of cardiac sPLA2 activity. Strategy for analytical isolation of cardiac sPLA2. Hearts were excised and homogenized, cardiac proteins (from 1.5 mg tissue) were resolved by molecular weight (non‐reducing SDS‐PAGE). After reverse staining (for protein band visualization without loss of activity), protein was eluted from the gel and assessed for sPLA2 activity (vertical bar diagram). MMP indicates matrix metalloproteinase; ND, not detected; sPLA2, secreted phospholipase A2; WT, wild‐type.
Figure 11.
Figure 11.
Expression characteristics of the sPLA2 elevated in Mmp2 deficiency. A, Dependence on MMP‐2 expression. Cardiac sPLA2 activity (bottom) and plasma MMP‐2 levels (top) in mice lacking neither copy (Mmp2+/+, n=4), 1 copy (Mmp2+/−, n=3) or 2 copies (Mmp2−/−, n=4) of Mmp2. Pooled samples were measured in duplicate. *P≤0.05 vs WT, t test. B, Lack of regulation by transcription. qRT‐PCR analysis of the entire family of known sPLA2s expressed in C57BL mice. PLA2G2A is not presented as the gene for this enzyme is disrupted in C57BL strain. n=4 mice per genotype. C, Enzyme inhibition assay with indoxam suggests that cardiac sPLA2 may be a mixture of various sPLA2 enzymes. MMP indicates matrix metalloproteinase; ND, not detected; qRT‐PCR, quantitative real‐time polymerase chain reaction; sPLA2, secreted phospholipase A2; WT, wild‐type.
Figure 12.
Figure 12.
Evidence of proinflammatory actions of PLA2G5 in Mmp2‐deficient cells. A, qRT‐PCR analysis of Pla2g5 expression in mouse fibroblasts treated with siRNA sequences to inhibit the expression of PLA2G5. Sequence 2 was selected for further analyses. Pools of n=4 were measured in triplicate. B, qRT‐PCR analysis of inflammatory marker genes, fibrosis marker genes, and MMPs in fibroblasts treated with siRNA to inhibit the expression of PLA2G5. Pools of n=4 were measured in triplicate. *P≤0.05 vs WT+control siRNA. P≤0.05 vs Mmp2−/−+control siRNA. All pairwise multiple comparisons vs control group (Holm–Sidak method). MMP indicates matrix metalloproteinase; ND, not detected; qRT‐PCR, quantitative real‐time polymerase chain reaction; WT, wild‐type.
Figure 13.
Figure 13.
Effect of MMP‐2 on sPLA2 activity. A, Recombinant human PLA2G5 or PLA2G10 (4 μmol/L) were incubated for 4 hours with or without MMP‐2 (400 nmol/L). Plasma of WT or Mmp2−/− mice was incubated for 16 hours with or without MMP‐2 (100 nmol/L). Results shown are representative of 3 separate experiments. B, Western blot with PLA2G5 antibody showing lack of cleavage of recombinant human PLA2G5 by MMP‐2. C, Determination of PLA2G5 content in mouse plasma by Western blot with PLA2G5‐specific antibodies. The analysis suggests similar yet negligible PLA2G5 immunoreactivity in plasma of WT and Mmp2−/− mice. Note that PLA2G5 immunoreactivity was not affected by incubation with MMP‐2. D, Determination of PLA2G5 in the heart of WT and Mmp2−/− mice by time resolved fluorescence immunoassay (TRFIA). The analysis suggests similar yet negligible PLA2G5 immunoreactivity in heart homogenates of either WT or Mmp2−/− mice; this was in line with the qRT‐PCR data for Pla2g5 (shown in Figure 11B). E, MMP‐2 does not cleave cardiac sPLA2. Lack of effect of incubation with recombinant human MMP‐2 on the sPLA2 from Mmp2−/− heart homogenates (pool of n=3 hearts). Heart homogenate was incubated with or without MMP‐2 (400 nmol/L) for 4 hours. Left: Total sPLA2 activity. Right: Electrophoretic migration of sPLA2 activity on Tricine‐SDS‐PAGE (scatter plot). MMP indicates matrix metalloproteinase; qRT‐PCR, quantitative real‐time polymerase chain reaction; sPLA2, secreted phospholipase A2; WT, wild‐type.
Figure 14.
Figure 14.
MMP‐2 is a negative regulator of the release of active sPLA2 from the myocardium. A, Scheme of experimental protocol. B, sPLA2 activity released ex vivo from WT or Mmp2−/− myocardial specimens. *P≤0.05 vs WT, t test. C, Left: sPLA2 activity released ex vivo from Mmp2−/− myocardial specimens from mice transduced with either AdMMP‐2 or AdGFP. P≤0.05 vs Mmp2−/−+AdGFP, t test. Right: To measure the molecular weight of released sPLA2, the myocardial releasates were pooled and resolved by nonreducing SDS‐PAGE followed by sPLA2 activity assay. Data corresponds to an incubation time of 40 minutes for Mmp2−/− mice transduced with AdGFP or AdMMP‐2. D, sPLA2 activity released from ex vivo heart sections in the absence and presence of Brefeldin A (70 μmol/L), a drug that blocks the endoplasmic reticulum to Golgi transition along the classical secretory pathway. P≤0.05 vs Mmp2+/−−Brefeldin A. §P≤0.05 vs Mmp2−/−+Brefeldin A. All pairwise multiple‐comparison procedures (Holm–Sidak method). Data correspond to an incubation time of 100 minutes for nontransduced WT and Mmp2−/− mice. AdGFP indicates green fluorescent protein–expressing adenovirus; AdMMP, MMP‐2‐encoding adenovirus; MMP, matrix metalloproteinase; MW, molecular weight; SDS‐PAGE, sodium‐dodecylsulfate polyacrylamide gel electrophoresis; sPLA2, secreted phospholipase A2; WT, wild‐type.
Figure 15.
Figure 15.
The MMP‐2 inhibitor doxycycline replicates aspects of the phenotype of Mmp2 deficiency. A, Analysis of WT mice administered doxycycline (50 mg/kg per day) for 0 to 15 days (2 weeks). (n=4 mice per time point). The sPLA2 activity of pools was measured in duplicate. *P≤0.05 vs day 0. One‐way repeated‐measures ANOVA. All pairwise multiple‐comparison procedures (Student‐Newman‐Keuls method). qRT‐PCR analysis of indicated inflammatory markers was conducted for individual mice. *P≤0.05 vs day 0. All pairwise multiple comparisons (Holm–Sidak method). B, Analysis of Mmp2−/− mice administered doxycycline (50 mg/kg per day) for 0 to 15 days (2 weeks). (n=3 per time point). The sPLA2 activity of pools was measured in duplicate. qRT‐PCR analysis of indicated inflammatory markers was conducted for individual mice. *P≤0.05 vs day 0. All pairwise multiple comparisons (Holm–Sidak method). ANOVA indicates analysis of variance; MMP, matrix metalloproteinase; qRT‐PCR, quantitative real‐time polymerase chain reaction; sPLA2, secreted phospholipase A2; WT, wild‐type.
Figure 16.
Figure 16.
Emerging functions of the MMP‐2/sPLA2 axis in cardiac inflammatory gene expression. A, Cardiac PGE2 concentrations in mice treated with or without varespladib (10 mg/kg per day for 2 days). Pools of n=3 mice per genotype were measured in duplicate. B, qRT‐PCR of inflammatory marker genes in mice treated with or without varespladib (10 mg/kg per day for 2 days). n=3 mice per genotype. *P≤0.05 vs WT−Varespladib (control). P≤0.05 vs Mmp2−/−−Varespladib (control). All pairwise multiple comparisons vs control group (Holm–Sidak method). MMP indicates matrix metalloproteinase; PGE2, prostaglandin E2; qRT‐PCR, quantitative real‐time polymerase chain reaction; sPLA2, secreted phospholipase A2; WT, wild‐type.
Figure 17.
Figure 17.
Proof‐of‐principle of the proinflammatory activity of cardiac sPLA2. A, Strategy for preparative isolation of cardiac sPLA2 from Mmp2−/− mice (donor). Hearts were excised and homogenized, cardiac proteins (from 500 mg tissue) were resolved by nonreducing SDS‐PAGE. After reverse staining, protein eluted from the gel was assessed for sPLA2 activity, and the active fraction was filter‐sterilized and injected into WT mice (recipient). An aliquot was used for enzyme kinetic analysis to confirm its identity (ie, same KMapp) as the sPLA2 found in cardiac homogenates and plasma. B, sPLA2 activity in the plasma and hearts of WT mice injected with cardiac sPLA2 isolated from Mmp2−/− mice. n=3 WT mice. *P≤0.05 vs vehicle, t test. C, qRT‐PCR of inflammatory marker genes in WT mice injected with cardiac sPLA2 isolated from Mmp2−/− mice. n=3 WT mice. *P≤0.05 vs vehicle, t test. MMP indicates matrix metalloproteinase; qRT‐PCR, quantitative real‐time polymerase chain reaction; SDS‐PAGE, sodium‐dodecylsulfate polyacrylamide gel electrophoresis; sPLA2, secreted phospholipase A2; WT, wild‐type.
Figure 18.
Figure 18.
Emerging functions of the MMP‐2/sPLA2 axis in cardiac lipid metabolic gene expression and blood pressure homeostasis. A, qRT‐PCR of key lipid metabolic genes in mice treated with or without varespladib (10 mg/kg per day for 2 days). n=3 mice per genotype. B, Systolic blood pressure of mice orally administered vehicle (soybean oil, 130 μL, 2 doses), varespladib (10 mg/kg per day, 130 μL, 2 doses), or indomethacin (10 mg/kg per day, 130 μL, 1 dose). Blood pressure was measured 4 hours after administration of the last dose. n=3 mice per genotype. *P≤0.05 vs WT−varespladib (control). P≤0.05 vs Mmp2−/−−vehicle/untreated (control). All pairwise multiple comparisons vs control group (Holm–Sidak method). MMP indicates matrix metalloproteinase; qRT‐PCR, quantitative real‐time polymerase chain reaction; sPLA2, secreted phospholipase A2; WT, wild‐type.
Figure 19.
Figure 19.
A heart‐centric MMP‐2/sPLA2 axis may modulate blood pressure homeostasis, inflammatory and metabolic gene expression, as well as the severity of fever. Future research should establish whether cardiac sPLA2 is activated secondary to preexisting inflammation or if it is the primary cause of the inflammatory state characteristic of MMP‐2 gene deficiency. MMP indicates matrix metalloproteinase; sPLA2, secreted phospholipase A2.

Similar articles

Cited by

References

    1. Lijnen HR, Collen D. Matrix metalloproteinase system deficiencies and matrix degradation. Thromb Haemost. 1999; 82:837-845. - PubMed
    1. Tuysuz B, Mosig R, Altun G, Sancak S, Glucksman MJ, Martignetti JA. A novel matrix metalloproteinase 2 (MMP2) terminal hemopexin domain mutation in a family with multicentric osteolysis with nodulosis and arthritis with cardiac defects. Eur J Hum Genet. 2009; 17:565-572. - PMC - PubMed
    1. Fraser H, Hislop C, Christie RM, Rick HL, Reidy CA, Chouinard ML, Eacho PI, Gould KE, Trias J. Varespladib (A‐002), a secretory phospholipase A(2) inhibitor, reduces atherosclerosis and aneurysm formation in ApoE(‐/‐) mice. J Cardiovasc Pharmacol. 2009; 53:60-65. - PubMed
    1. Mosig RA, Dowling O, DiFeo A, Ramirez MC, Parker IC, Abe E, Diouri J, Aqeel AA, Wylie JD, Oblander SA, Madri J, Bianco P, Apte SS, Zaidi M, Doty SB, Majeska RJ, Schaffler MB, Martignetti JA. Loss of MMP‐2 disrupts skeletal and craniofacial development and results in decreased bone mineralization, joint erosion and defects in osteoblast and osteoclast growth. Hum Mol Genet. 2007; 16:1113-1123. - PMC - PubMed
    1. Greenlee KJ, Werb Z, Kheradmand F. Matrix metalloproteinases in lung: multiple, multifarious, and multifaceted. Physiol Rev. 2007; 87:69-98. - PMC - PubMed

Publication types