. 2015 Jul;78(1):21-38.
doi: 10.1002/ana.24410. Epub 2015 Jun 10.

Syndromic parkinsonism and dementia associated with OPA1 missense mutations

Affiliations

Syndromic parkinsonism and dementia associated with OPA1 missense mutations

Valerio Carelli et al. Ann Neurol. 2015 Jul.

Abstract

Objective: Mounting evidence links neurodegenerative disorders such as Parkinson disease and Alzheimer disease with mitochondrial dysfunction, and recent emphasis has focused on mitochondrial dynamics and quality control. Mitochondrial dynamics and mtDNA maintenance is another link recently emerged, implicating mutations in the mitochondrial fusion genes OPA1 and MFN2 in the pathogenesis of multisystem syndromes characterized by neurodegeneration and accumulation of mtDNA multiple deletions in postmitotic tissues. Here, we report 2 Italian families affected by dominant chronic progressive external ophthalmoplegia (CPEO) complicated by parkinsonism and dementia.

Methods: Patients were extensively studied by optical coherence tomography (OCT) to assess retinal nerve fibers, and underwent muscle and brain magnetic resonance spectroscopy (MRS), and muscle biopsy and fibroblasts were analyzed. Candidate genes were sequenced, and mtDNA was analyzed for rearrangements.

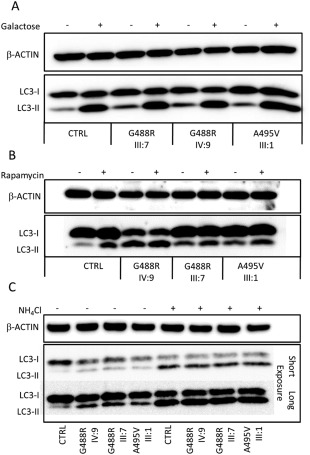
Results: Affected individuals displayed a slowly progressive syndrome characterized by CPEO, mitochondrial myopathy, sensorineural deafness, peripheral neuropathy, parkinsonism, and/or cognitive impairment, in most cases without visual complains, but with subclinical loss of retinal nerve fibers at OCT. Muscle biopsies showed cytochrome c oxidase-negative fibers and mtDNA multiple deletions, and MRS displayed defective oxidative metabolism in muscle and brain. We found 2 heterozygous OPA1 missense mutations affecting highly conserved amino acid positions (p.G488R, p.A495V) in the guanosine triphosphatase domain, each segregating with affected individuals. Fibroblast studies showed a reduced amount of OPA1 protein with normal mRNA expression, fragmented mitochondria, impaired bioenergetics, increased autophagy and mitophagy.

Interpretation: The association of CPEO and parkinsonism/dementia with subclinical optic neuropathy widens the phenotypic spectrum of OPA1 mutations, highlighting the association of defective mitochondrial dynamics, mtDNA multiple deletions, and altered mitophagy with parkinsonism.


Figures

Figure 1
Figure 1
Pedigrees of Family 1 (A) and Family 2 (B). The arrows indicate the probands, whereas asterisks indicate family members who underwent genetic analysis. Black symbols denote the affected individuals; the presence of Parkinsonism (P) and dementia (D) are further indicated. Pedigree 1 is composed of 2 branches that share the same founder mutational event, although the parental relationship could not formally be reconstructed.
Figure 2
Figure 2
mtDNA multiple deletion, muscle histopathology, and OPA1 alignment. (A, B) Long‐range polymerase chain reaction shows an accumulation of mtDNA multiple deletions, more abundant in Family 1 (A), and lower in Family 2 (B), congruent with muscle histoenzymatic stainings. Cytochrome c oxidase (COX)/succinate dehydrogenase (SDH) and hematoxylin and eosin (HE) stains show numerous COX‐negative and ragged‐red fibers in muscle biopsy from Case III:11 (A; Family 1), whereas the muscle biopsy from Case III:1 (B; Family 2) shows only scattered COX‐negative fibers and a slight subsarcolemmal increase of SDH reaction. Scale bars = 100μm (A) and 50μm (B). (C) Global alignment of OPA1 protein sequences from eukaryotes shows that both mutations (p.G488R and p.A495R) affect 2 highly conserved residues in vertebrates, contiguous or close to invariant residues. The surrounding protein domain is conserved in eukaryotes and vertebrates. Amino acid residues with a percentage of conservation ranging between 70.0 and 79.9% are highlighted in light gray, those between 80.0 and 99.9% are highlighted in dark gray, and those invariant (100%) are highlighted in black.
Figure 3
Figure 3
Brain magnetic resonance imaging in the 2 probands from Family 1 (III:7 and III:11). (A) Structural 3‐dimensional T1 images show cerebral cortical atrophy, mild cerebellar atrophy, and increased perivascular spaces with riddled features at the level of basal ganglia and substantia nigra (see enlarged). (B) Axial fluid‐attenuated inversion recovery (FLAIR) T2 images show subcortical lacunar lesions and mild hyperintensity of the periventricular white matter. (C) Coronal fast spin echo T2 images show signal change in the globi pallidi (arrow) that correspond to calcifications on computed tomography scan. (D) Pathological lactate accumulation was detected by proton magnetic resonance spectroscopy at the level of the ventricular cerebrospinal fluid (volume of interest is displayed in the insert). Both cases displayed the same lesion pattern with more severe leukoencephalopathy, as evident in the FLAIR T2 images in III:11 (B).
Figure 4
Figure 4
Single photon emission computed tomographic imaging/DaT scan in the 3 probands from Family 1 (III‐7 and III‐11) and Family 2 (III‐1). In III‐7 (Family 1), with parkinsonism, there is a bilateral dopaminergic defect (right > left). In III‐11 (Family 1), with cognitive impairment but without clinical parkinsonism, there is a mild bilateral dopaminergic defect. In III‐1 (Family 2), with parkinsonism, there is a bilateral dopaminergic defect (right > left).
Figure 5
Figure 5
Ophthalmological findings in 5 affected subjects from Family 1. (A) Humphrey visual field (total deviation, which indicates the deviation of the patient's results from those of age‐matched controls at each test location). (B, C) Spectral domain–optic coherence tomography (SD‐OCT) assessments (retinal nerve fiber layer [RNFL]). (D) SD‐OCT assessments (ganglion cell–inner plexiform layer [GC‐IPL]). Ophthalmological findings show variable degrees of impairment. III‐7, the proband, has a subclinical temporal reduction of RNFL thickness, similar to IV‐4 and IV‐9. Individuals III‐11 and IV‐5 display a more generalized reduction of RNFL thickness (more severe in III‐11). GC‐IPL analysis shows a consistent loss of macular retinal ganglion cells in all subjects, IV‐9 being the least severe. Correspondingly, visual fields have variable degrees of impairment, mildest in IV:9, whereas III:11 could not complete the examination. OD, oculus destrum; OS, oculus sinistrum; INF, inferior; NAS, nasal; SUP, superior; TEMP, temporal.
Figure 6
Figure 6
Morphology of mitochondrial network. (A) Control (n = 3) and patient (n = 5) fibroblasts were incubated in Dulbecco modified Eagle medium galactose for 48 hours, and then loaded with MitoTracker Red as described in Subjects and Methods. Representatives of eight similar images are shown for each cell line. Scale bar = 25μm. WT = wild type. (B, C) Bar graphs show the distribution of the fibroblasts into 3 different categories on the basis of mitochondrial morphology (filamentous, intermediate, and fragmented) by blind test. Twenty‐six control fibroblasts, 21 fibroblasts with the p.G488R mutation, and 34 with the p.A495V mutation were counted in glucose medium; 20 control fibroblasts, 29 fibroblasts with the p.G488R mutation, and 33 with the p.A495V mutation were counted in galactose medium. Fibroblasts analyzed were from 3 control subjects, 3 subjects with the p.G488R mutation, and 2 with the p.A495V mutation.
Figure 7
Figure 7
OPA1 protein amount and bioenergetics in control and mutant fibroblasts. (A) Representative Western blot of OPA1, b‐tubulin, and VDAC was carried out in fibroblast lysates obtained from 3 controls and from patients carrying the indicated OPA1 mutations. (B) OPA1 bands were normalized to β‐tubulin and VDAC band density. Results are means ± standard error of the mean (SEM) of 4 controls and the 5 OPA1 mutant fibroblast lysates obtained from 3 independent experiments and resolved in at least 3 blots. Asterisks denote values significantly different from controls (p < 0.05). (C) Mitochondrial adenosine triphosphate (ATP) synthesis. Fibroblasts were treated with 50μg/ml digitonin, and the rate of ATP synthesis driven by 5mM pyruvate plus 5mM malate (complex I), 10mM succinate plus 4mM rotenone (complex II), or 25mM glycerol 3‐phosphate plus 4mM rotenone (mitochondrial glycerol phosphate dehydrogenase) was subsequently determined. The rate of ATP synthesis was normalized for citrate synthase (CS) activity. Data (mean ± SEM) were obtained from 5 controls and the 5 OPA1 mutant fibroblasts grouped by mutation type. The experiment was performed at least in triplicate. Asterisk denotes values significantly different from controls (p < 0.05). (D) Effect of oligomycin on mitochondrial membrane potential. Control and OPA1 mutant fibroblasts were loaded with tetramethylrhodamine methyl ester (TMRM) as described Subjects and Methods. Where indicated, 6µM oligomycin (O) and 4µM carbonyl cyanide 4‐(trifluoromethoxy) phenylhydrazone (FCCP; F) were added. Data are mean ± SEM (n = 10). Fluorescence readings following the addition of oligomycin and preceding that of FCCP revealed a statistically significant difference (p < 0.05) for all time points between fibroblasts with the p.G488R mutation and both controls and fibroblasts with the p.A495V mutation.
Figure 8
Figure 8
Autophagy in control and mutant fibroblasts. Representative immunoblots are shown, documenting the conversion of nonlipidated microtubule‐associated protein 1 light chain 3 (LC3)‐I to its cleaved and lipidated variant LC3‐II in skin fibroblasts obtained from a healthy donor and 3 patients. Where indicated (+), the cells were incubated in Dulbecco modified Eagle medium–galactose for 48 hours (A), rapamycin 10µM for 2 hours (B), and NH4Cl 20μM for 2 hours (C). As control for the equal loading of lanes, an anti–β‐actin antibody was used.
Figure 9
Figure 9
Confocal microscopy analysis of mitophagy in control and mutant fibroblasts cultured in glucose and galactose medium. (A) Skin fibroblasts obtained from a healthy donor and 3 investigated patients were incubated in Dulbecco modified Eagle medium (DMEM) glucose or DMEM galactose for 48 hours. Before experiments, cells were loaded with LysoTracker Red and MitoTracker Green to visualize lysosomes and mitochondria, respectively. The degree of the signal of lysosomes with mitochondria (merge) was calculated via cell live imaging microscopy by using a Nikon Swept Field confocal microscope equipped with a CFI Plan Apo VC60XH objective (numerical aperture = 1.4; for details see Subjects and Methods). The confocal images shown are representative of a minimum of 18 cells from at least 3 independent experiments performed in duplicate. Sequentially zoomed regions (insets) from the fluorescent confocal merge images (×4 and ×8 from the original picture, respectively) illustrate the lysosome (red signal) and mitochondria (green signal) colocalization, appearing as yellow areas indicative of mitophagy (arrows). Scale bars = 10μm in merge pictures, 2.5μm in ×4 pictures, 1.25μm in ×8 pictures. (B) The graph represents the amount of colocalization between lysosomes (red signal) and mitochondria (green signal). The rate of colocalization of green and red signals was evaluated using the colocalization counter JACOP available in Fiji software. Data are presented as mean ± standard deviation. *p < 0.01, **p < 0.05; ns = not significant.
Figure 10
Figure 10
Confocal microscopy assessment of mitophagy in control and mutant fibroblasts cultured in glucose and after carbonyl cyanide 4‐(trifluoromethoxy) phenylhydrazone (FCCP)‐driven uncoupling. (A) Control and mutant fibroblasts were cultured in complete medium and treated with FCCP 1μM for 30 minutes, under the same colocalization conditions of MitoTracker Green and LysoTracker Red fluorescence as for assessment of mitophagic activity by cell live imaging microscopy. Confocal images were obtained with a Nikon Swept Field confocal microscope equipped with a VC60XH immersion objective lens (numerical aperture = 1.4; for details see Subjects and Methods). The images shown are representative of a minimum of 20 cells from at least 3 independent experiments performed in duplicate. Sequentially zoomed regions (insets) from fluorescent confocal merge images (×4 and ×8 from the original picture, respectively) illustrate the lysosome (red signal) and mitochondria (green signal) colocalization, appearing as yellow areas indicative of mitophagy (arrows). Scale bars = 10μm in merge pictures, 2.5μm in ×4 pictures, 1.25μm in ×8 pictures. (B) The graph represents the amount of colocalization between lysosomes (red signal) and mitochondria (green signal). Data are presented as mean ± standard deviation. *p < 0.01, **p < 0.05; ns = not significant.

References

    1. Zeviani M, Servidei S, Gellera C, et al. An autosomal dominant disorder with multiple deletions of mitochondrial DNA starting at the D‐loop region. Nature 1989;339:309–311. - PubMed
    1. Spinazzola A, Zeviani M. Disorders of nuclear‐mitochondrial intergenomic communication. Biosci Rep 2007;27:39–51. - PubMed
    1. Van Goethem G, Dermaut B, Lofgren A, et al. Mutation of POLG is associated with progressive external ophthalmoplegia characterized by mtDNA deletions. Nat Genet 2001;28:211–212. - PubMed
    1. Longley MJ, Clark S, Yu Wai Man C, et al. Mutant POLG2 disrupts DNA polymerase gamma subunits and causes progressive external ophthalmoplegia. Am J Hum Genet 2006;78:1026–1034. - PMC - PubMed
    1. Spelbrink JN, Li FY, Tiranti V, et al. Human mitochondrial DNA deletions associated with mutations in the gene encoding Twinkle, a phage T7 gene 4‐like protein localized in mitochondria. Nat Genet 2001;28:223–231. - PubMed

Publication types