Long-term Coexposure to Hexavalent Chromium and B[a]P Causes Tissue-Specific Differential Biological Effects in Liver and Gastrointestinal Tract of Mice
- PMID: 25820237
- PMCID: PMC4476460
- DOI: 10.1093/toxsci/kfv070
Long-term Coexposure to Hexavalent Chromium and B[a]P Causes Tissue-Specific Differential Biological Effects in Liver and Gastrointestinal Tract of Mice
Abstract
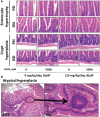
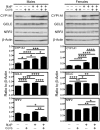
Complex mixtures of environmental agents often cause mixture-specific health effects that cannot be accounted for by a single mechanism. To study the biological effects of exposure to a mixture of chromium-VI and benzo[a]pyrene (B[a]P), often found together in the environment, we exposed mice for 60 days to 0, 55, 550, or 5500 ppb Cr(VI) in drinking water followed by 90 days of coexposure to B[a]P at 0, 1.25, 12.5, or 125 mg/kg/day and examined liver and gastrointestinal (GI) tract for exposure effects. In the liver, the mixture caused more significant histopathology than expected from the sum of effects of the individual components, while in the GI tract, Cr(VI) alone caused significant enterocyte hypertrophy and increases in cell proliferation and DNA damage that were also observed in mice coexposed to B[a]P. Expression of genes involved in drug metabolism, tumor suppression, oxidative stress, and inflammation was altered in mixed exposures relative to control and to singly exposed mice. Drug metabolism and oxidative stress genes were upregulated and tumor suppressor and inflammation genes downregulated in the proximal GI tract, whereas most markers were upregulated in the distal GI tract and downregulated in the liver. Oral exposure to Cr(VI) and B[a]P mixtures appears to have tissue-specific differential consequences in liver and GI tract that cannot be predicted from the effects of each individual toxicant. Tissue specificity may be particularly critical in cases of extended exposure to mixtures of these agents, as may happen in the occupational setting or in areas where drinking water contains elevated levels of Cr(VI).
Keywords: B[a]P; complex mixtures; gene expression; heavy metals; hexavalent chromium.
© The Author 2015. Published by Oxford University Press on behalf of the Society of Toxicology. All rights reserved. For Permissions, please e-mail: journals.permissions@oup.com.
Figures


Similar articles
-
Long-term exposure to low-concentrations of Cr(VI) induce DNA damage and disrupt the transcriptional response to benzo[a]pyrene.Toxicology. 2014 Feb 28;316:14-24. doi: 10.1016/j.tox.2013.12.001. Epub 2013 Dec 26. Toxicology. 2014. PMID: 24374135 Free PMC article.
-
Lack of genotoxic effects in hematopoietic and gastrointestinal cells of mice receiving chromium(VI) with the drinking water.Mutat Res. 2008 Jul-Aug;659(1-2):60-7. doi: 10.1016/j.mrrev.2007.11.005. Epub 2007 Nov 19. Mutat Res. 2008. PMID: 18155955 Review.
-
NTP toxicity studies of sodium dichromate dihydrate (CAS No. 7789-12-0) administered in drinking water to male and female F344/N rats and B6C3F1 mice and male BALB/c and am3-C57BL/6 mice.Toxic Rep Ser. 2007 Jan;(72):1-G4. Toxic Rep Ser. 2007. PMID: 17342194
-
Gut microflora & toxic metals: chromium as a model.Indian J Med Res. 2004 Feb;119(2):49-59. Indian J Med Res. 2004. Retraction in: Indian J Med Res. 2013 Dec;138(6):1038. PMID: 15055483 Retracted. Review.
-
Effects of chromium (VI) on the toxicity of benzo[z]pyrene in 16HBE cells.Toxicol Ind Health. 2022 Nov;38(11):733-744. doi: 10.1177/07482337221127095. Epub 2022 Sep 15. Toxicol Ind Health. 2022. PMID: 36271631
Cited by
-
Chromium disrupts chromatin organization and CTCF access to its cognate sites in promoters of differentially expressed genes.Epigenetics. 2018;13(4):363-375. doi: 10.1080/15592294.2018.1454243. Epub 2018 May 3. Epigenetics. 2018. PMID: 29561703 Free PMC article.
-
Hexavalent chromium promotes differential binding of CTCF to its cognate sites in Euchromatin.Epigenetics. 2021 Dec;16(12):1361-1376. doi: 10.1080/15592294.2020.1864168. Epub 2021 Jan 7. Epigenetics. 2021. PMID: 33319643 Free PMC article.
-
Occupational Exposure to Hexavalent Chromium, Nickel and PAHs: A Mixtures Risk Assessment Approach Based on Literature Exposure Data from European Countries.Toxics. 2022 Jul 29;10(8):431. doi: 10.3390/toxics10080431. Toxics. 2022. PMID: 36006111 Free PMC article.
-
Heavy metals, oxidative stress, and the role of AhR signaling.Toxicol Appl Pharmacol. 2024 Jan;482:116769. doi: 10.1016/j.taap.2023.116769. Epub 2023 Nov 23. Toxicol Appl Pharmacol. 2024. PMID: 38007072 Free PMC article. Review.
-
Hexavalent chromium increases the metabolism and genotoxicity of aromatic amine carcinogens 4-aminobiphenyl and β-naphthylamine in immortalized human lung epithelial cells.Toxicol Appl Pharmacol. 2022 Aug 15;449:116095. doi: 10.1016/j.taap.2022.116095. Epub 2022 Jun 2. Toxicol Appl Pharmacol. 2022. PMID: 35662664 Free PMC article.
References
-
- American Conference of Governmental Industrial Hygienists (ACGIH). (2003). TLVs® and BEIs. Threshold Limit Values for Chemical Substances and Physical Agents and Biological Exposure Indices. Cincinnati, Ohio.
-
- Birnbaum L. S., Devito M. J. (1995). Use of toxic equivalency factors for risk assessment for dioxins and related compounds. Toxicology 105, 391–401. - PubMed
-
- Cefalu W. T., Wang Z. Q., Zhang X. H., Baldor L. C., Russell J. C. (2002). Oral chromium picolinate improves carbohydrate and lipid metabolism and enhances skeletal muscle Glut-4 translocation in obese, hyperinsulinemic (JCR-LA corpulent) rats. J. Nutr. 132, 1107–1114. - PubMed
-
- Cizmas L., McDonald T. J., Phillips T. D., Gillespie A. M., Lingenfelter R. A., Kubena L. F., Phillips T. D., Donnelly K. C. (2004). Toxicity characterization of complex mixtures using biological and chemical analysis in preparation for assessment of mixture similarity. Environ. Sci. Technol. 38, 5127–5133. - PubMed
-
- Collins J. F., Brown J. P., Alexeeff G. V., Salmon A. G. (1998). Potency equivalency factors for some polycyclic aromatic hydrocarbons and polycyclic aromatic hydrocarbon derivatives. Regul. Toxicol. Pharmacol. 28, 45–54. - PubMed
Publication types
MeSH terms
Substances
Grants and funding
LinkOut - more resources
Full Text Sources
Other Literature Sources

