

Cockayne syndrome group B protein regulates DNA double-strand break repair and checkpoint activation
- PMID: 25820262
- PMCID: PMC4491999
- DOI: 10.15252/embj.201490041
Cockayne syndrome group B protein regulates DNA double-strand break repair and checkpoint activation
Abstract
Mutations of CSB account for the majority of Cockayne syndrome (CS), a devastating hereditary disorder characterized by physical impairment, neurological degeneration and segmental premature aging. Here we report the generation of a human CSB-knockout cell line. We find that CSB facilitates HR and represses NHEJ. Loss of CSB or a CS-associated CSB mutation abrogating its ATPase activity impairs the recruitment of BRCA1, RPA and Rad51 proteins to damaged chromatin but promotes the formation of 53BP1-Rif1 damage foci in S and G2 cells. Depletion of 53BP1 rescues the formation of BRCA1 damage foci in CSB-knockout cells. In addition, knockout of CSB impairs the ATM- and Chk2-mediated DNA damage responses, promoting a premature entry into mitosis. Furthermore, we show that CSB accumulates at sites of DNA double-strand breaks (DSBs) in a transcription-dependent manner. The kinetics of DSB-induced chromatin association of CSB is distinct from that of its UV-induced chromatin association. These results reveal novel, important functions of CSB in regulating the DNA DSB repair pathway choice as well as G2/M checkpoint activation.
Keywords: CSB; DNA damage checkpoint; DNA double‐strand break repair.
© 2015 The Authors.
Figures
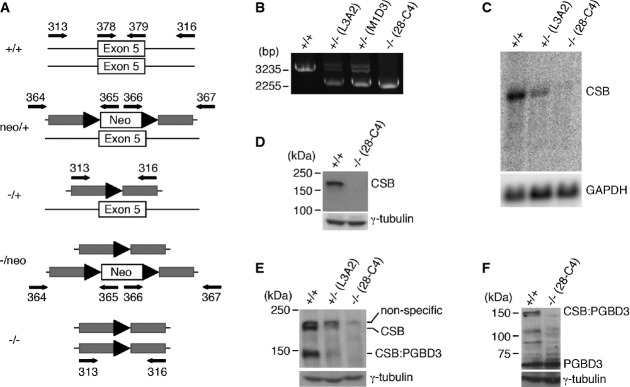
Schematic diagram of rAAV-mediated gene targeting of exon 5 of CSB. Gray horizonal bars represent homology arms flanking exon 5 of CSB. Black arrowheads represent loxP sites.
Analysis of PCR products amplified with the primer set 313 and 316 and genomic DNA isolated from parental hTERT-RPE cells, the heterozygote cell clones (L3A2 and M1D3) and the CSB homozygous cell clone (28-C4). Molecular weight markers corresponding to 3,225 bp and 2,255 bp are indicated on the left.
Northern blot analysis of RNA isolated from parental hTERT-RPE cells, the heterozygous cell clone L3A2 and the homozygous cell clone 28-C4. GAPDH was used as a loading control.
Western analysis with an antibody against the C-terminus of CSB (Abcam). γ-tubulin was used as a loading control in this and subsequent figures.
Western analysis with an antibody against the N-terminus of CSB (Bethyl).
Western analysis with an antibody against PGBD3.
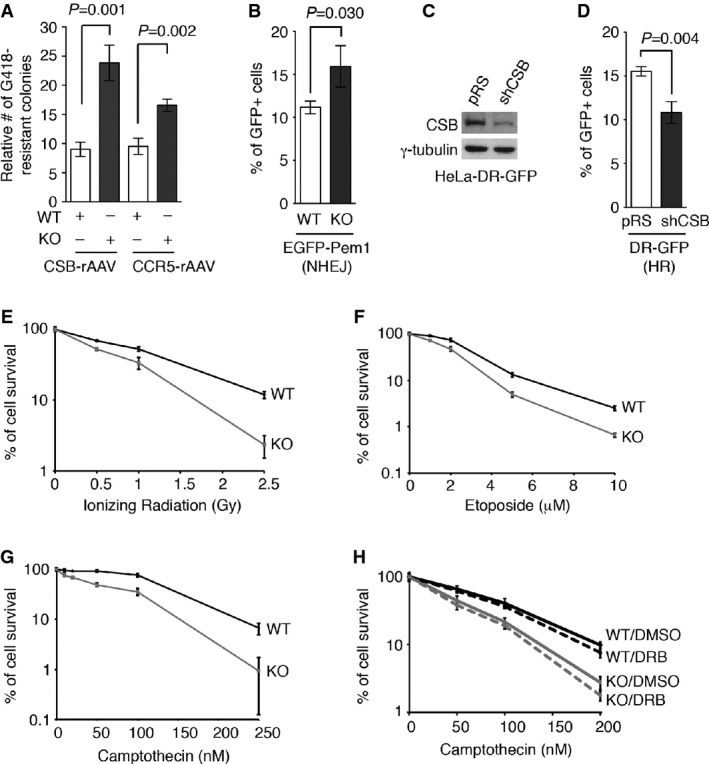
A Quantification of the frequency of random integration of two independent rAAV targeting vectors (CSB-rAAV and CCR-rAAV). Standard deviations from three independent experiments are indicated.
B NHEJ-mediated repair of I-SceI-induced DNA DSBs. The parental (WT) and the CSB-KO (KO) cells were cotransfected with pEGFP-Pem1-Ad2, pCherry and I-SceI expression constructs. The number of cells positive for both GFP and pCherry was normalized to the total number of pCherry-positive cells, giving rise to the percentage of normalized GFP-positive cells. Standard deviations from three independent experiments are indicated.
C Western analysis of CSB in HeLa-DR-GFP transiently transfected with the vector alone or shCSB.
D HR-mediated repair of I-SceI-induced DNA DSBs. HeLa-DR-GFP transiently expressing the vector alone or shCSB were cotransfected with pCherry and I-SceI expression constructs. The percentage of normalized GFP-positive cells was calculated as described in (B). Standard deviations from three independent experiments are indicated.
E–G Clonogenic survival assays of the parental (WT) and the CSB-KO (KO) cells following various doses of ionizing radiation (IR) (E), etoposide (Etop) (F), or camptothecin (CPT) (G). Standard deviations from at least three experiments are indicated.
H Clonogenic survival assays. Both WT and CSB-KO cells were treated with 50 μM DRB, prior to the addition of various doses of CPT. Standard deviations from at least three experiments are indicated.

Quantification of percentage of cyclin A-positive and cyclin A-negative cells exhibiting 10 or more IR-induced γH2AX foci. Both parental (WT) and CSB-KO (KO) cells were treated with 2 Gy IR and fixed 1 h, 4 h and 8 h post-IR. A total of at least 1,500 cells from three independent experiments were scored in blind.
Quantification of the percentage of cells with 10 or more IR-induced BRCA1 foci. Cells (WT and KO) were treated with 2 Gy IR and fixed 1 h and 4 h post-IR. A total of at least 1,500 cells from three independent experiments were scored in blind.
Quantification of percentage of cyclin A-positive and cyclin A-negative cells displaying 10 or more IR-induced BRCA1 foci. Cells were treated with 2 Gy IR and scored as described in (B).
Quantification of the percentage of cyclin A-positive cells with 10 or more IR-induced RPA32-pS4/pS8 foci. Cells (WT and KO) were treated with 10 Gy IR and fixed 4 h and 8 h post-IR. A total of 750 cells from three independent experiments were scored in blind.
Quantification of percentage of cells with 10 or more IR-induced Rad51 foci. Cells (WT and KO) were treated with 10 Gy IR and fixed 4 h and 8 h post-IR. A total of 750 cells from three independent experiments were scored in blind.
Clonogenic survival assays of olaparib-treated parental (WT) and CSB-KO (KO) cells as indicated.
Quantification of percentage of cells with 10 or more IR-induced Rad51 foci. Cells (WT and KO) were treated with actinomycin D (1 μg/ml) or DRB (50 μM) prior to 10 Gy IR and then fixed 8 h post-IR. A total of at least 1,500 cells from three independent experiments were scored in blind.
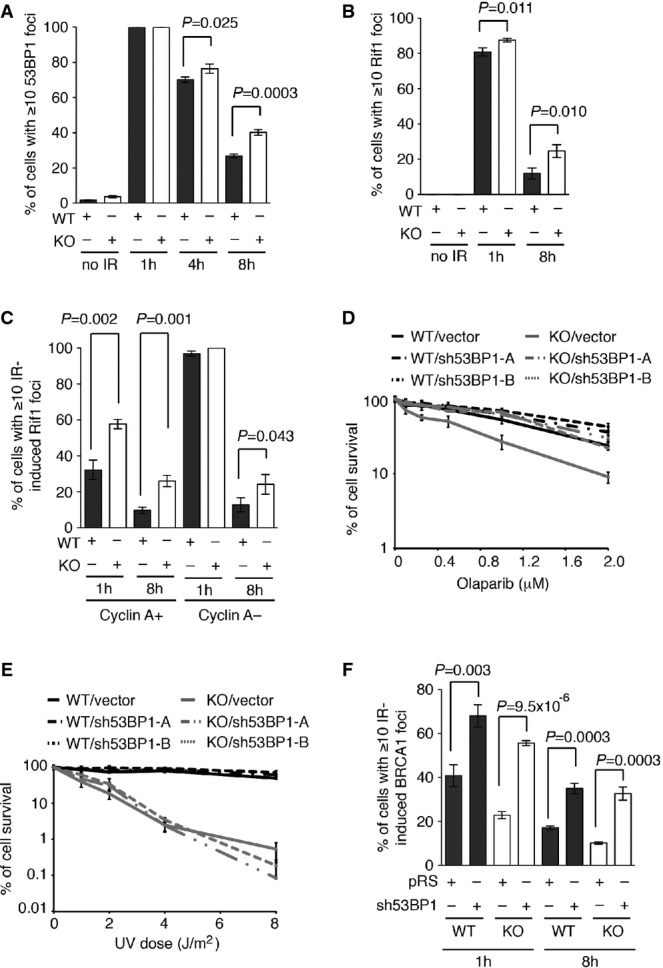
Quantification of percentage of cells with 10 or more IR-induced 53BP1 foci. Cells (WT and KO) were treated with 2 Gy IR and fixed 1 h, 4 h and 8 h post-IR. A total of 1,500 cells from three independent experiments were scored in blind.
Quantification of percentage of cells with 10 or more IR-induced Rif1 foci. Cells (WT and KO) were treated with 2 Gy IR and fixed 1 h and 8 h post-IR. A total of 750 cells from three independent experiments were scored in blind.
Quantification of the percentage of cyclin A-positive and cyclin A-negative cells with 10 or more IR-induced Rif1 foci. Cells were treated and scored as described in (B).
Clonogenic survival assays of olaparib-treated parental (WT) and CSB-KO (KO) cells stably expressing the vector alone, sh53BP1-A or sh53BP1-B as indicated.
Clonogenic survival assays of UV-treated parental (WT) and CSB-KO (KO) cells stably expressing the vector alone, sh53BP1-A or sh53BP1-B as indicated.
Quantification of percentage of cells with 10 or more IR-induced BRCA1 foci. Parental (WT) and knockout (KO) stably expressing the vector (pRS) alone or sh53BP1-A were treated with 2 Gy IR and fixed 1 and 8 h post-IR. A total of at least 1,500 cells from three independent experiments were scored in blind.
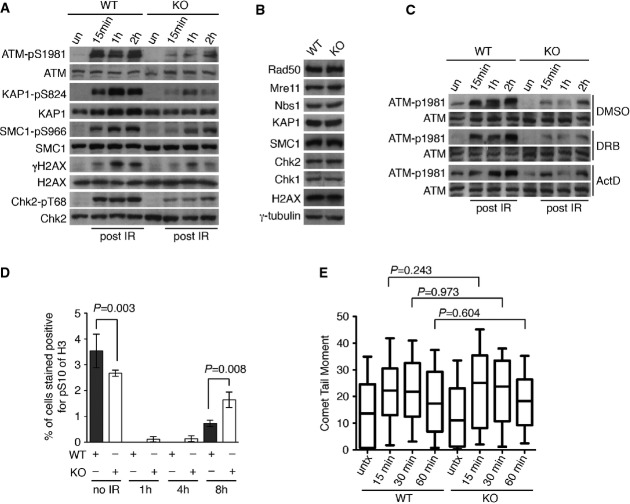
Western analysis of the parental (WT) and the CSB-KO (KO) cells that were either mock-treated or treated with 5 Gy IR. Immunoblotting was performed with anti-ATM-pS1981, anti-ATM, anti-KAP1-pS824, anti-KAP1, anti-SMC1-pS966, anti-SMC1, anti-γH2AX, anti-H2AX, anti-Chk2-pT68 and anti-Chk2 antibodies.
Western analysis of WT and CSB-KO cells. Immunoblotting was performed with anti-Rad50, anti-Mre11, anti-Nbs1, anti-KAP1, anti-SMC1, anti-Chk2, anti-Chk1, anti-H2AX and anti-γ-tubulin antibodies. The anti-γ-tubulin blot was used as a loading control.
Western analysis. WT and CSB-KO cells were treated with DMSO, DRB or actinomycin D (ActD) prior to 5 Gy IR. Immunoblotting was performed with anti-ATM-pS1981 and anti-ATM antibodies.
Quantification of the percentage of cells staining positive for H3-pS10. For each cell line, at least 3,000 cells from three independent experiments were scored in blind. Standard deviations from three independent experiments are indicated. P-values were determined using two-tailed unpaired Student’s t-test.
Quantification of comet tail moment. Both WT and CSB-KO cells were treated with 10 Gy IR and harvested for comet assays 15 min, 30 min and 1 h post-IR. At least 200 cells were scored for each sample. In the box and whisker plot, boxes extend from the 25th to 75th percentiles whereas whiskers are from the 10th to 90th percentiles. P-values were determined using non-parametric Mann-Whitney rank-sum t-test.
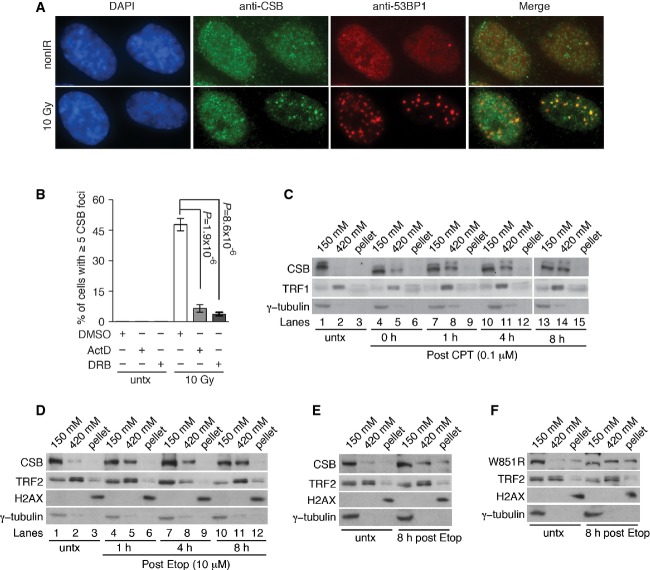
A Analysis of indirect immunofluorescence with an anti-CSB antibody in conjunction with an anti-53BP1 antibody. hTERT-RPE cells were treated with 10 Gy IR and fixed 8 h post-IR. Cell nuclei were stained with DAPI (blue).
B CSB accumulation at sites of DNA DSBs is severely impaired by actinomycin D or DRB treatment. Quantification of hTERT-RPE cells with five or more IR-induced CSB damage foci in cells. Cells were treated with actinomycin D (1 μg/ml, ActD) for 1 h or DRB (50 μM) for 2 h prior to 10 Gy IR and maintained in the drugs for 8 h post-IR. A total of at least 1,500 cells from three independent experiments were scored in blind. Standard deviations from three independent experiments are indicated. P-values were determined using two-tailed unpaired Student’s t-test
C, D Analysis of differential salt extraction of chromatin. hTERT-RPE cells were treated with 0.1 μM CPT (C) or 10 μM Etop (D) for 1 h and then released from drugs for various time points as indicated. Immunoblotting was performed with anti-CSB antibody. The anti-TRF1, anti-TRF2, anti-H2AX and anti-γ-tubulin blots were used as controls for differential salt extraction.
E, F Analysis of differential salt extraction of chromatin. The CSB-KO cells stably expressing either wild-type CSB (E) or mutant CSB-W851R (F) were treated with 10 μM etoposide (Etop) for 1 h and then released from Etop for 8 h. Immunoblotting was performed with anti-CSB, anti-TRF2, anti-H2AX and anti-γ-tubulin antibodies.
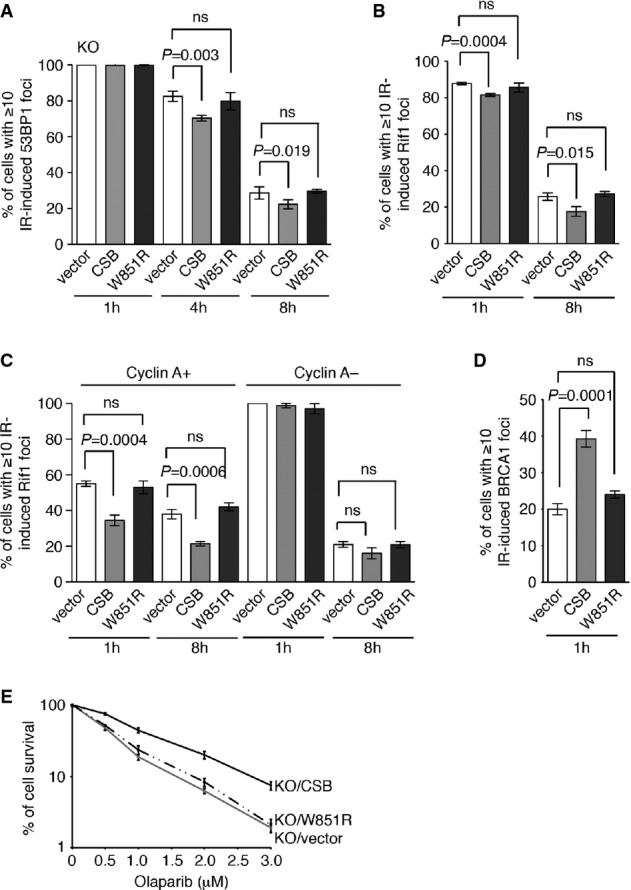
Quantification of percentage of cells with 10 or more IR-induced 53BP1 foci. CSB-KO cells stably expressing wild-type CSB, CSB-W851R or the vector alone were treated with 2 Gy IR and fixed 1 h, 4 h and 8 h post-IR. A total of 1,500 cells from three independent experiments were scored in blind for each cell line.
Quantification of percentage of cells with 10 or more IR-induced Rif1 foci. CSB-KO cells stably expressing wild-type CSB, CSB-W851R or the vector alone were treated with 2 Gy IR and fixed 1 h and 8 h post-IR. A total of 1,500 cells from three independent experiments were scored in blind for each cell line.
Quantification of percentage of cyclin A-positive and cyclin A-negative cells with 10 or more IR-induced Rif1 foci. Cells were treated and fixed as described in (B). A total of 750 cells from three independent experiments were scored in blind for each cell line. Standard deviations from three independent experiments are indicated.
Quantification of percentage of cells with 10 or more IR-induced BRCA1 foci. Cells were treated with 2 Gy IR and fixed 1 h post-IR. A total of 1,500 cells from three independent experiments were scored in blind for each cell line.
Clonogenic survival assays of olaparib-treated CSB-KO cells stably expressing wild-type CSB, CSB-W851R or the vector alone as indicated.
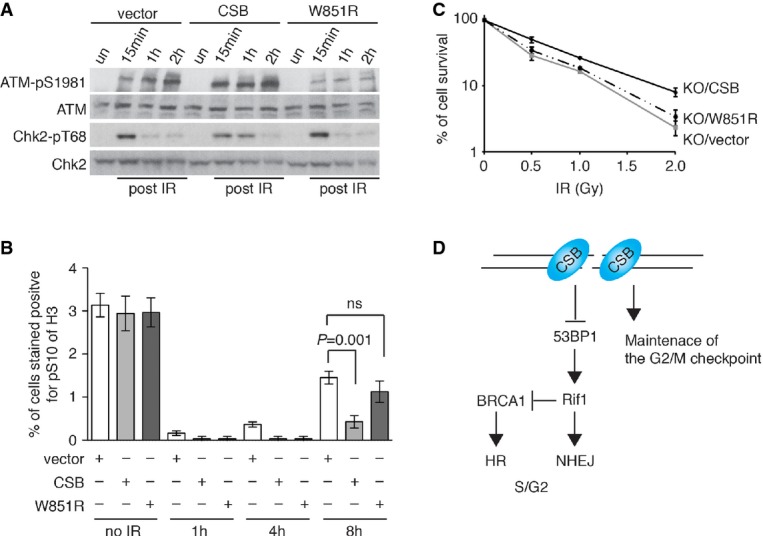
Western analysis of CSB-KO cells stably expressing wild-type CSB, CSB-W851R or the vector alone as indicated. Cells were either mock-treated or treated with 5 Gy IR. Immunoblotting was performed with anti-ATM, anti-ATM-pS1981, anti-Chk2 and anti-Chk2-pT68 antibodies.
Quantification of the percentage of cells stained positive for H3-pS10. Cells were either mock-treated or treated with 2 Gy IR. For each cell line, at least 3,000 cells from three independent experiments were scored in blind. P-values were determined using two-tailed unpaired Student’s t-test.
Clonogenic survival assays of IR-treated CSB-KO (KO) cell stably expressing wild-type CSB, CSB-W851R or the vector alone as indicated.
Model for the role of CSB in repressing NHEJ and maintaining the G2/M checkpoint. See text for more information.
References
-
- Aamann MD, Sorensen MM, Hvitby C, Berquist BR, Muftuoglu M, Tian J, de Souza-Pinto NC, Scheibye-Knudsen M, Wilson DM, 3rd, Stevnsner T, Bohr VA. Cockayne syndrome group B protein promotes mitochondrial DNA stability by supporting the DNA repair association with the mitochondrial membrane. FASEB J. 2010;24:2334–2346. - PMC - PubMed
-
- Bakkenist CJ, Kastan MB. DNA damage activates ATM through intermolecular autophosphorylation and dimer dissociation. Nature. 2003;421:499–506. - PubMed
Publication types
MeSH terms
Substances
Grants and funding
LinkOut - more resources
Full Text Sources
Other Literature Sources
Molecular Biology Databases
Research Materials
Miscellaneous
