Review
. 2015 Jun;109(6):366-78.
doi: 10.1093/trstmh/trv024. Epub 2015 Mar 27.

Mapping the zoonotic niche of Marburg virus disease in Africa

Affiliations
Review

Mapping the zoonotic niche of Marburg virus disease in Africa

David M Pigott et al. Trans R Soc Trop Med Hyg. 2015 Jun.

Abstract

Background: Marburg virus disease (MVD) describes a viral haemorrhagic fever responsible for a number of outbreaks across eastern and southern Africa. It is a zoonotic disease, with the Egyptian rousette (Rousettus aegyptiacus) identified as a reservoir host. Infection is suspected to result from contact between this reservoir and human populations, with occasional secondary human-to-human transmission.

Methods: Index cases of previous human outbreaks were identified and reports of infection in animals recorded. These data were modelled within a species distribution modelling framework in order to generate a probabilistic surface of zoonotic transmission potential of MVD across sub-Saharan Africa.

Results: Areas suitable for zoonotic transmission of MVD are predicted in 27 countries inhabited by 105 million people. Regions are suggested for exploratory surveys to better characterise the geographical distribution of the disease, as well as for directing efforts to communicate the risk of practices enhancing zoonotic contact.

Conclusions: These maps can inform future contingency and preparedness strategies for MVD control, especially where secondary transmission is a risk. Coupling this risk map with patient travel histories could be used to guide the differential diagnosis of highly transmissible pathogens, enabling more rapid response to outbreaks of haemorrhagic fever.

Keywords: Boosted regression trees; Filovirus; Marburg virus disease; Rousettus aegyptiacus; Species distribution models; Viral haemorrhagic fever.


Figures

Figure 1.
Figure 1.
Case numbers in previous Marburg virus disease outbreaks. The size of each circle is proportional to the number of cases of the disease in a given outbreak. Outbreaks are labelled as per Table 1.
Figure 2.
Figure 2.
The epidemiology of marburgvirus transmission in Africa. B represents suspected bat reservoirs (including Egyptian rousettes). Susceptible animals include non-human primates, such as the monkeys responsible for the 1967 outbreaks (P). H represents humans. Question marks indicate potential animals of other species. All routes have been confirmed or are suspected to occur apart from transmission between bats and primates, which remains unknown. Adapted from Laminger and Prinz and Groseth et al.,
Figure 3.
Figure 3.
The locations of marburgvirus disease outbreaks in humans and reported animal infections across Africa. This figure is available in black and white in print and in colour at Transactions online.
Figure 4.
Figure 4.
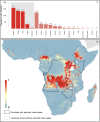
Predicted geographical distribution of the zoonotic niche for marburgviruses using model 1 – human index cases only. Panel A shows the total populations living in areas of risk of zoonotic transmission for each at-risk country. The grey rectangle highlights countries in which index cases of disease have been reported (set 1); the remainder are countries in which risk of zoonotic transmission is predicted, but in which index cases of Marburg virus disease have not been reported and have more than 100 at-risk pixels (set 2). These countries are ranked by population-at-risk within each set. The population-at-risk figure in 100 000 s is given above each bar. Panel B shows the predicted distribution of zoonotic marburgviruses. The scale reflects the relative probability that zoonotic transmission of marburgviruses could occur at these locations; areas closer to 1 (red) are more likely to harbour zoonotic transmission than those closer to 0 (blue). Countries with borders outlined are those which are predicted to contain at-risk areas for zoonotic transmission based on a thresholding approach (see Methods). The area under the curve statistic, calculated under a stringent cross-validation procedure is 0.64±0.12. Solid lines represent set 1 whilst dashed lines delimit set 2. Areas covered by major lakes have been masked white.
Figure 5.
Figure 5.
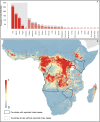
Predicted geographical distribution of the zoonotic niche for marburgviruses using model 2–both human index cases and infections in animals. Panel A shows the total populations living in areas of risk of zoonotic transmission for each at-risk country. The grey rectangle highlights countries in which index cases of Marburg virus disease have been reported (set 1); the remainder are countries in which risk of zoonotic transmission is predicted, but in which index cases of Marburg have not been reported and have more than 100 at-risk pixels (set 2). These countries are ranked by population-at-risk within each set. The population-at-risk figure in 100 000 s is given above each bar. Panel B shows the predicted distribution of zoonotic marburgviruses. The scale reflects the relative probability that zoonotic transmission of marburgviruses could occur at these locations; areas closer to 1 (red) are more likely to harbour zoonotic transmission than those closer to 0 (blue). Countries with borders outlined are those which are predicted to contain at-risk areas for zoonotic transmission based on a thresholding approach (see Methods). The area under the curve statistic, calculated under a stringent cross-validation procedure, is 0.62±0.08. Solid lines represent set 1 whilst dashed lines delimit set 2. Areas covered by major lakes have been masked white.
Figure 6.
Figure 6.
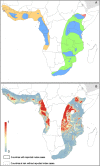
Difference between model predictions with animal data omitted. The difference between outputs for model 2 and model 1 are presented. Pixels in purple represent those regions predicted at higher risk in model 2; regions in green indicate areas where model 1 predicts higher risk. Yellow pixels represent areas with consistent probabilities. Pixels predicted not to be at-risk are in grey.
Figure 7.
Figure 7.
Expert opinion maps for the range of Egyptian rousettes. Panel A is derived from the IUCN and Kwiecinski et al., Blue regions are those where both depict Egyptian rousette populations. Red areas are those only indicated in the IUCN dataset. Orange sections are where bats of the subspecies R. aegyptiacus unicolor are thought to be present; green shows the distribution of bats of the subspecies R. aegyptiacus leachi. Panel B shows the predicted values from model 2, masked by the bat layer.

References

    1. Slenczka WG. The Marburg virus outbreak of 1967 and subsequent episodes. Curr Top Microbiol Immunol 1999;235:49–75. - PubMed
    1. Siegert R, Shu H-L, Slenczka W, et al. On the eitology of an unknown infection originating in monkeys [in German]. Dtsch med Wochenschr 1967;92:2341–3. - PubMed
    1. Conrad JL, Isaacson M, Smith EB, et al. Epidemiologic investigation of Marburg virus disease, Southern Africa, 1975. Am J Trop Med Hyg 1978;27:1210–5. - PubMed
    1. Bausch DG, Nichol ST, Muyembe-Tamfum JJ, et al. Marburg hemorrhagic fever associated with multiple genetic lineages of virus. N Engl J Med 2006;355:909–19. - PubMed
    1. Mylne A, Brady OJ, Huang Z, et al. A comprehensive database of the geographic spread of past human Ebola outbreaks. Sci Data 2014;1:e140042. - PMC - PubMed

Publication types