

A metabolic switch toward lipid use in glycolytic muscle is an early pathologic event in a mouse model of amyotrophic lateral sclerosis
- PMID: 25820275
- PMCID: PMC4492815
- DOI: 10.15252/emmm.201404433
A metabolic switch toward lipid use in glycolytic muscle is an early pathologic event in a mouse model of amyotrophic lateral sclerosis
Abstract
Amyotrophic lateral sclerosis (ALS) is the most common fatal motor neuron disease in adults. Numerous studies indicate that ALS is a systemic disease that affects whole body physiology and metabolic homeostasis. Using a mouse model of the disease (SOD1(G86R)), we investigated muscle physiology and motor behavior with respect to muscle metabolic capacity. We found that at 65 days of age, an age described as asymptomatic, SOD1(G86R) mice presented with improved endurance capacity associated with an early inhibition in the capacity for glycolytic muscle to use glucose as a source of energy and a switch in fuel preference toward lipids. Indeed, in glycolytic muscles we showed progressive induction of pyruvate dehydrogenase kinase 4 expression. Phosphofructokinase 1 was inhibited, and the expression of lipid handling molecules was increased. This mechanism represents a chronic pathologic alteration in muscle metabolism that is exacerbated with disease progression. Further, inhibition of pyruvate dehydrogenase kinase 4 activity with dichloroacetate delayed symptom onset while improving mitochondrial dysfunction and ameliorating muscle denervation. In this study, we provide the first molecular basis for the particular sensitivity of glycolytic muscles to ALS pathology.
Keywords: amyotrophic lateral sclerosis; exercise; glucose; lipids; muscle.
© 2015 The Authors. Published under the terms of the CC BY 4.0 license.
Figures
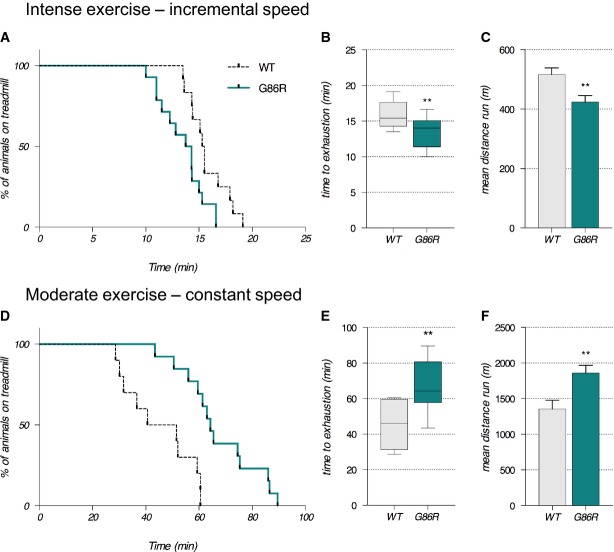
A–F (A–C) Exercise performance on a treadmill apparatus using an intense exercise (incremental speed paradigm) that relies solely on anaerobic metabolism. (D–F) Exercise performance on a treadmill apparatus using a moderate exercise (constant sub-maximal speed) that relies on the recruitment of aerobic metabolism and that is representative of endurance exercise. (A, D) Kaplan–Meier curves representing values corresponding to the percentage of mice still running at a given time point. (B, E) Median values of the time that mice ran are represented in the min to max graphical representation; 15.5 min for wild-type (WT) and 14.33 min for SOD1G86R in (B); 59.33 min for WT and 65.43 min for SOD1G86R in (E). (C, F) Mean distance run ± SEM by WT and SOD1G86R mice in (C) and by WT and SOD1G86R mice in (F).
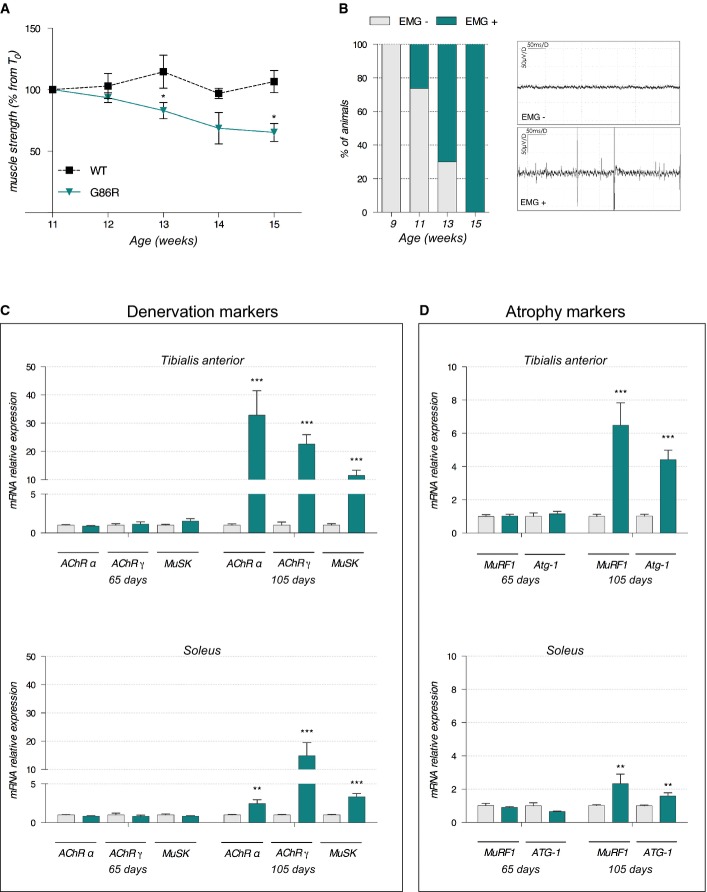
Grip test was performed to measure mouse muscle strength at different time points during disease progression. Graph represents the mean of percentage from initial force measured at 11 weeks ± SEM. At 13 weeks, *P = 0.03; at 14 weeks, P = 0.06; at 15 weeks, *P = 0.04 (n = 8 for WT and SOD1G86R, respectively, at 11–15 weeks, two-way ANOVA followed by Fisher's LSD post hoc test).
Electromyography (EMG) recordings were performed weekly during disease development, starting from 9 weeks of age. Spontaneous electrical activity was considered as positive EMG only for peak-to-peak amplitudes > 50 μV. Left: The percentage of mice presenting with positive EMG in each age group are represented. Right: Representative examples of negative (EMG−) and positive (EMG+) electromyography profiles (n = 10 for WT and SOD1G86R, respectively, at 9–13 weeks and n = 8 and 7 for WT and SOD1G86R, respectively, at 15 weeks).
Relative mRNA levels of denervation markers AChR (subunits α and γ) and MuSK were evaluated by qPCR at the indicated ages (65 and 105 days) in tibialis anterior (upper panels) and soleus (lower panels) of WT and SOD1G86R mice. Graphs represent mean fold change ± SEM from age-matched WT (n > 5). ***P-values versus WT: < 0.0001 for AChRα, AChRγ, and MuSK in tibialis anterior; and **P-values versus WT: 0.001 for AChRα, and ***P-values versus WT: 0.0007 for AChRγ, 0.0002 for MuSK in soleus (n=7 and 8 for WT and SOD1G86R, respectively, at 65 days; n = 5 and 6 for WT and SOD1G86R, respectively, at 105 days; two-way ANOVA followed by Fisher's LSD post hoc test).
Relative mRNA levels of muscle atrophy markers MuRF1 and Atg-1 were measured by qPCR at the indicated ages (65 and 105 days) in tibialis anterior (upper panels) and soleus (lower panels). Graphs represent mean fold change ± SEM from age-matched WT. ***P-values versus WT: < 0.0001 for MuRF1 and Atg-1 in tibialis anterior; and **P-values versus WT: 0.007 for MuRF1 and P = 0.006 for Atg-1 in soleus (n = 7 and 8 for WT and SOD1G86R, respectively, at 65 days, n = 5 and 6 for WT and SOD1G86R, respectively, at 105 days, two-way ANOVA followed by Fisher's LSD post hoc test).
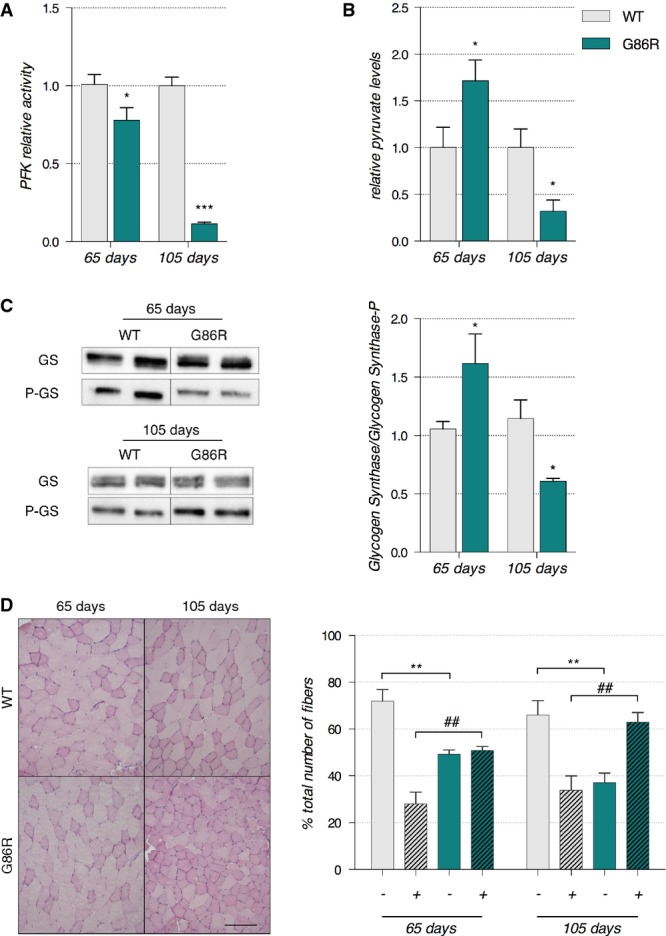
Enzymatic activity of phosphofructokinase in whole tibialis anterior muscle cytosolic homogenates is expressed as mean fold change ± SEM from age-matched WT at 65 days of age *P = 0.016 (WT n = 6, SOD1G86R n = 7) and 105 days of age ***P < 0.0001 (n = 5/genotype), two-way ANOVA followed by Fisher's LSD post hoc test. Data shown are representative of two independent experiments having similar results.
Pyruvate was measured in whole tibialis anterior muscle tissue homogenates. The mean fold change ± SEM compared to age-matched WT are represented with *P = 0.019 at 65 days of age (n = 5/genotype) and *P = 0.041 at 105 days of age (n = 4/genotype), two-way ANOVA followed by Fisher's LSD post hoc test. Data shown are representative of two independent experiments having similar results.
Left: Representative Western blot showing glycogen synthase and phosphorylated glycogen synthase levels. Right: Quantification represents the mean ratio of optical densities of glycogen synthase/P-glycogen synthase ± SEM. At 65 days of age n = 6/genotype, *P = 0.0162, and at 105 days of age n = 5/genotype, *P = 0.0163, two-way ANOVA followed by Fisher's LSD post hoc test.
Left: Representative microphotographs of PAS staining from WT and SOD1G86R tibialis anterior cross-sections at 65 and 105 days of age showing glycogen-negative (light pink) and glycogen-positive (dark pink) fibers. Scale bar: 200 μm. Right: Quantification of glycogen-negative (−) and glycogen-positive (+) fibers at 65 and 105 days of age. For (−) fibers: **P-values versus WT: 0.0026 at 65 days and 0.0074 at 105 days, for (+) fibers: ##P-values versus WT: 0.0025 at 65 days and 0.0073 at 105 days (n = 5/genotype at 65 days and n = 4/genotype at 105 days, two-way ANOVA followed by Fisher's LSD post hoc test).
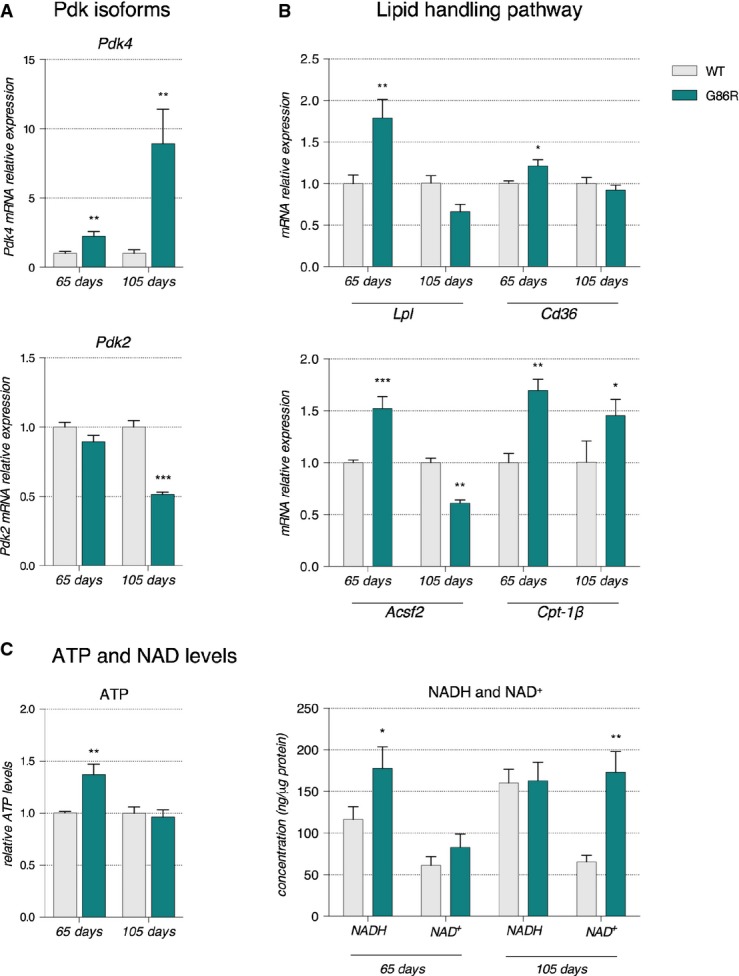
Relative mRNA levels of Pdk4 and Pdk2 evaluated by qPCR at the indicated ages in tibialis anterior of WT and SOD1G86R mice. Graphs represent mean fold change ± from age-matched WT. Pdk4: **P-values versus WT: 0.014 at 65 days and 0.018 at 105 days; Pdk2: ***P-value versus WT < 0.0001 at 105 days. n = 7 and 8 for WT and SOD1G86R, respectively, at 65 days; n = 5/genotype at 105 days, two-way ANOVA followed by Fisher's LSD post hoc test.
Relative mRNA levels of genes involved in lipid handling evaluated by qPCR at the indicated ages in tibialis anterior of WT and SOD1G86R mice. Graphs represent mean fold change ± SEM from age-matched WT. P-values versus WT: Lpl **P = 0.0009, Cd36 *P = 0.051, Acsf2 ***P < 0.0001 at 65 days, **P = 0.0059 at 105 days and Cpt-1β **P = 0.01 at 65 days and *P = 0.02 at 105 days (n = 6 and 7 for WT and SOD1G86R, respectively, at 65 days; n = 10 and 8 for WT and SOD1G86R, respectively, at 105 days, two-way ANOVA followed by Fisher's LSD post hoc test).
Relative levels of (left) ATP and (right) NADH and NAD+ measured in total tibialis anterior homogenates of WT and SOD1G86R mice. Left: Graphs represent mean fold change ± SEM in ATP from age-matched WT. **P = 0.002 (n = 9 and 12 for WT and SOD1G86R, respectively, at 65 days; n = 10/genotype at 105 days, two-way ANOVA followed by Fisher's LSD post hoc test). Right: The amounts of NADH and NAD+ relative to protein content in whole tibialis anterior homogenates are represented as mean ± SEM. *P = 0.027 and **P = 0.001 (n = 5, Student's t-test).
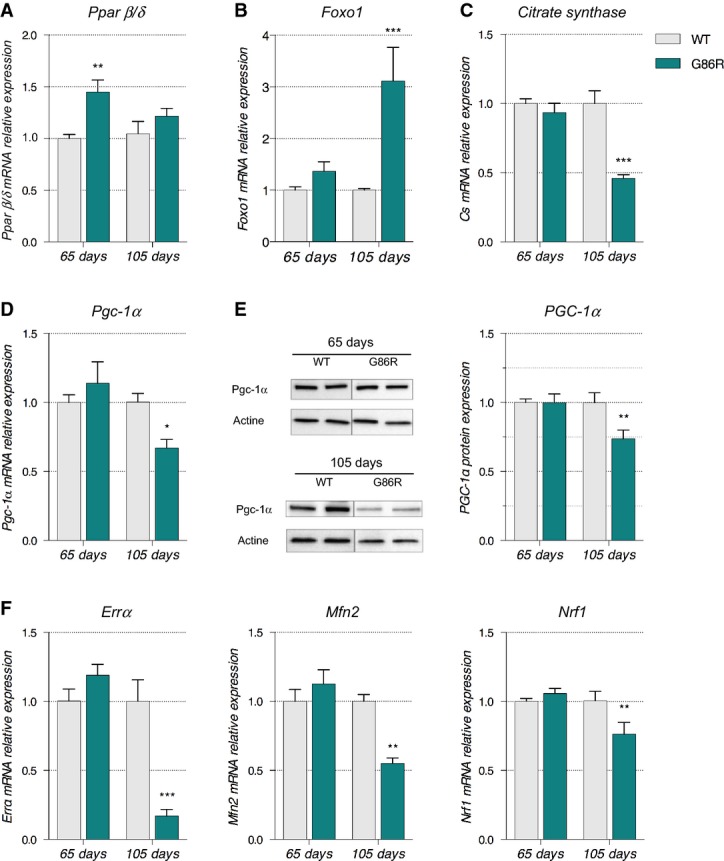
A–D Relative mRNA levels of (A) Pparß/δ, (B) Foxo1, (C) citrate synthase, and (D) Pgc-1α were evaluated by qPCR at the indicated ages in tibialis anterior of WT and SOD1G86R mice. Graphs represent mean fold change ± SEM from age-matched WT. P-values versus WT: Pparβ/δ **P = 0.0016 at 65 days; Foxo1 ***P = 0.0001 at 105 days, citrate synthase ***P < 0.0001 at 105 days, Pgc-1α *P = 0.0104 at 105 days (n = 7 and 8 for WT and SOD1G86R, respectively, at 65 days; n = 5/genotype at 105 days, two-way ANOVA followed by Fisher's LSD post hoc test).
E Representative Western blot of PGC-1α and respective actin that was used for normalization. PGC-1α protein levels in tibialis anterior muscle tissue are represented as mean fold change ± SEM from age-matched WT. **P-values versus WT: 0.02 (n = 6/genotype at 65 days; n = 5/genotype at 105 days, two-way ANOVA followed by Fisher's LSD post hoc test).
F Relative mRNA levels of ERRα, Mfn2, and Nrf1 were evaluated by qPCR at the indicated ages in tibialis anterior of WT and SOD1G86R mice. Graphs represent mean fold change ± SEM from age-matched WT. P-values versus WT: ERRα ***P < 0.0001, Mfn2 **P = 0.002 and Nrf1 **P = 0.009 (n = 6–7 and 7–8 for WT and SOD1G86R, respectively, at 65 days; n = 5 and 6 for WT and SOD1G86R, respectively, at 105 days, two-way ANOVA followed by Fisher's LSD post hoc test).
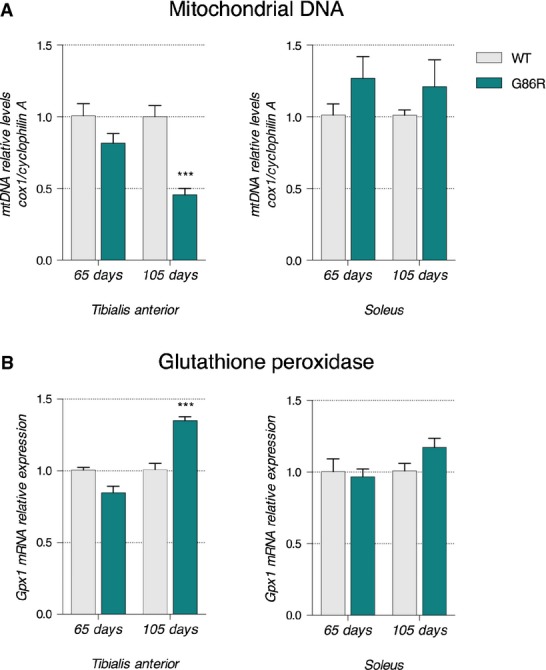
Mitochondrial DNA (mtDNA) was quantified using qPCR. Relative mtDNA levels are expressed as the ratio between mitochondrial-encoded gene Cox1 and the nuclear-encoded gene cyclophilin A. Graphs represent mean fold change ± SEM from age-matched WT for tibialis anterior (left panel) and soleus (right panel) of WT and SOD1G86R mice. ***P < 0.0001 (n = 5 and 4 for WT and SOD1G86R, respectively, at 65 days; n = 6/genotype at 105 days, two-way ANOVA followed by Fisher's LSD post hoc test).
Relative mRNA levels of Gpx1 were measured by qPCR at the indicated ages in tibialis anterior (left panel) and soleus (right panel) of WT and SOD1G86R mice. Graphs represent mean fold change ± SEM from age-matched WT. ***P < 0.0001 (n = 7 and 8 for WT and SOD1G86R, respectively, at 65 days; n = 9 and 8 for WT and SOD1G86R, respectively, at 105 days, two-way ANOVA followed by Fisher's LSD post hoc test).
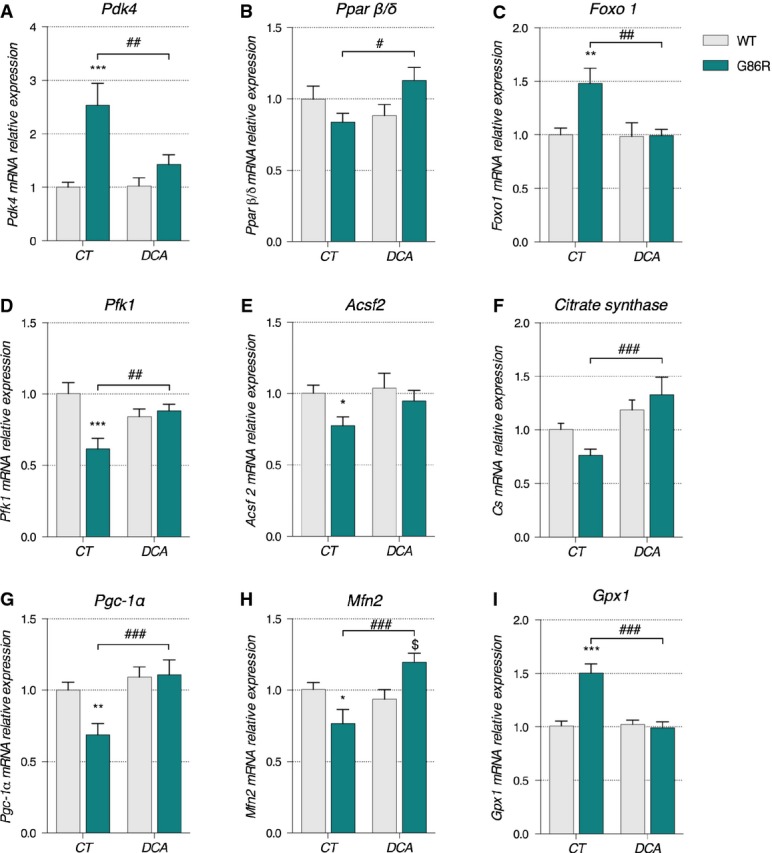
A–I Relative mRNA levels of (A) Pdk4, (B) Pparβ/δ, (C) Foxo1, (D) Pfk1, (E) Acsf2, (F) citrate synthase, (G) PGC-1α, (H) Mfn2, and (I) Gpx1 were evaluated by qPCR in tibialis anterior of control (CT) or DCA-treated (DCA) WT and SOD1G86R mice. Graphs represent mean fold change ± SEM from CT WT group. P-values versus WT: Pdk4 ***P = 0.002 and ##P = 0.0039, Pparβ/δ #P = 0.0178, Foxo1 **P = 0.0033 and ##P = 0.0038, Pfk1 ***P = 0.0002 and ##P = 0.0080, Acsf2 *P = 0.0437, citrate synthase ###P = 0.0004, Pgc-1α **P = 0.0084 and ###P = 0.0009, Mfn2 *P = 0.0272, $P = 0.0145 and ###P = 0.0002 and Gpx1 ***P < 0.0001 and ###P < 0.0001 (n = 9/genotype in CT groups, n = 9 and 8 for WT and SOD1G86R, respectively, in DCA group, two-way ANOVA followed by Fisher's LSD post hoc test).
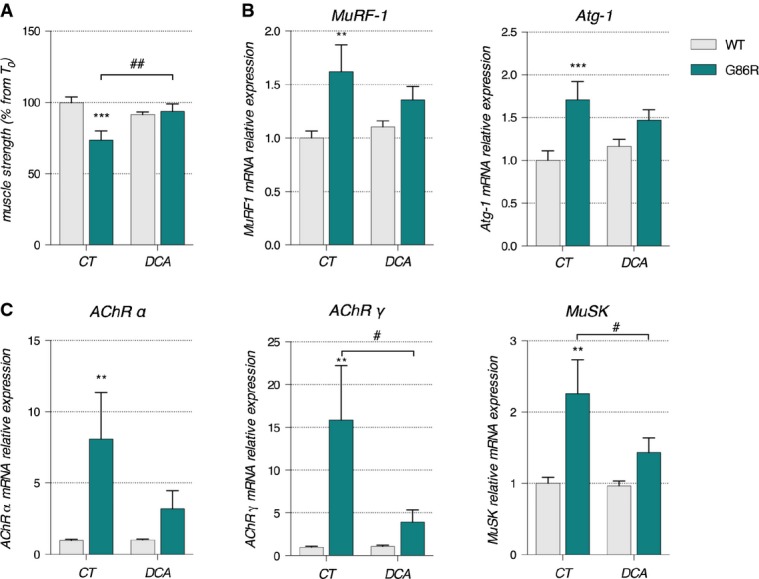
Grip strength is represented as mean of percent from T0 for each experimental group ± SEM. ##P = 0.0045 and ***P = 0.0003 (n = 9/genotype in CT groups, n = 9 and 8 for WT and SOD1G86R, respectively, in DCA group, two-way ANOVA followed by Fisher's LSD post hoc test).
Relative mRNA levels of muscular atrophy markers Murf1 and Atg-1 were measured by qPCR in tibialis anterior of control (CT) or DCA-treated (DCA) WT and SOD1G86R mice. Graphs represent mean fold change ± SEM from CT WT group. **P = 0.0079 and ***P = 0.0018 (n = 9/genotype in CT groups, n = 9 and 8 for WT and SOD1G86R, respectively, in DCA group, two-way ANOVA followed by Fisher's LSD post hoc test).
Relative mRNA levels of denervation markers AChRα, AChRγ, and MuSK were measured by qPCR in tibialis anterior of control (CT) or DCA-treated (DCA) WT and SOD1G86R mice. Graphs represent mean fold change ± SEM from CT WT group. **P = 0.015 for AChRα, #P = 0.028 and **P = 0.074 for AChRγ, #P = 0.042 and **P = 0.0029 for MuSK (n = 9/genotype in CT groups, n = 9 and 8 for WT and SOD1G86R, respectively, in DCA group, two-way ANOVA followed by Fisher's LSD post hoc test).
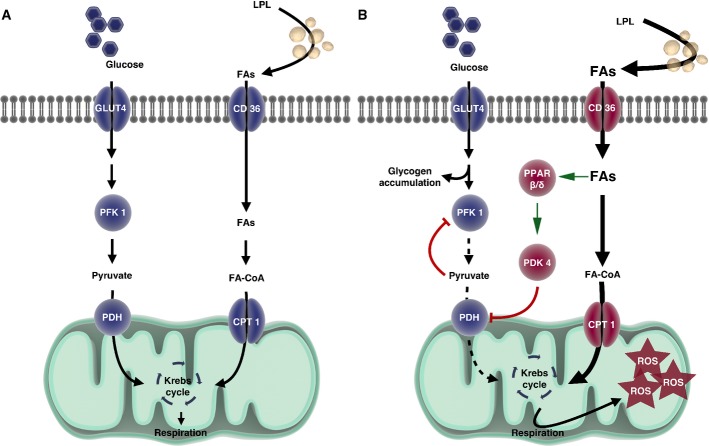
Under normal conditions in WT mice, both glucose and lipids enter the cell and are used as cellular fuels. In this situation, both pathways are used and are driven by PDK4 according to needs and fuel availability.
In the case of ALS, metabolic flexibility is lost because of chronically increased PDK4 and subsequent inhibition of PDH and PFK1 leading to glycogen accumulation. Increased lipid use through β-oxidation that can only function under aerobic conditions may underlie the greater endurance capacity in SOD1G86R mice. With time, the cell produces more reactive oxygen species, thereby inducing cellular damage.
References
-
- Abdel-Aleem S. Regulation of fatty acid oxidation by acetyl-CoA generated from glucose utilization in isolated myocytes. J Mol Cell Cardiol. 1996;28:825–833. - PubMed
-
- Andersen PM, Al-Chalabi A. Clinical genetics of amyotrophic lateral sclerosis: what do we really know? Nat Rev Neurol. 2011;7:603–615. - PubMed
-
- Atkin JD, Scott RL, West JM, Lopes E, Quah AK, Cheema SS. Properties of slow- and fast-twitch muscle fibres in a mouse model of amyotrophic lateral sclerosis. Neuromuscul Disord. 2005;15:377–388. - PubMed
Publication types
MeSH terms
LinkOut - more resources
Full Text Sources
Other Literature Sources
Medical
Molecular Biology Databases
Miscellaneous
