

Targeting DDX3 with a small molecule inhibitor for lung cancer therapy
- PMID: 25820276
- PMCID: PMC4492822
- DOI: 10.15252/emmm.201404368
Targeting DDX3 with a small molecule inhibitor for lung cancer therapy
Abstract
Lung cancer is the most common malignancy worldwide and is a focus for developing targeted therapies due to its refractory nature to current treatment. We identified a RNA helicase, DDX3, which is overexpressed in many cancer types including lung cancer and is associated with lower survival in lung cancer patients. We designed a first-in-class small molecule inhibitor, RK-33, which binds to DDX3 and abrogates its activity. Inhibition of DDX3 by RK-33 caused G1 cell cycle arrest, induced apoptosis, and promoted radiation sensitization in DDX3-overexpressing cells. Importantly, RK-33 in combination with radiation induced tumor regression in multiple mouse models of lung cancer. Mechanistically, loss of DDX3 function either by shRNA or by RK-33 impaired Wnt signaling through disruption of the DDX3-β-catenin axis and inhibited non-homologous end joining-the major DNA repair pathway in mammalian somatic cells. Overall, inhibition of DDX3 by RK-33 promotes tumor regression, thus providing a compelling argument to develop DDX3 inhibitors for lung cancer therapy.
Keywords: DDX3; DNA repair; lung cancer; radiation‐sensitizing agent; small molecule inhibitor.
© 2015 The Authors. Published under the terms of the CC BY 4.0 license.
Figures
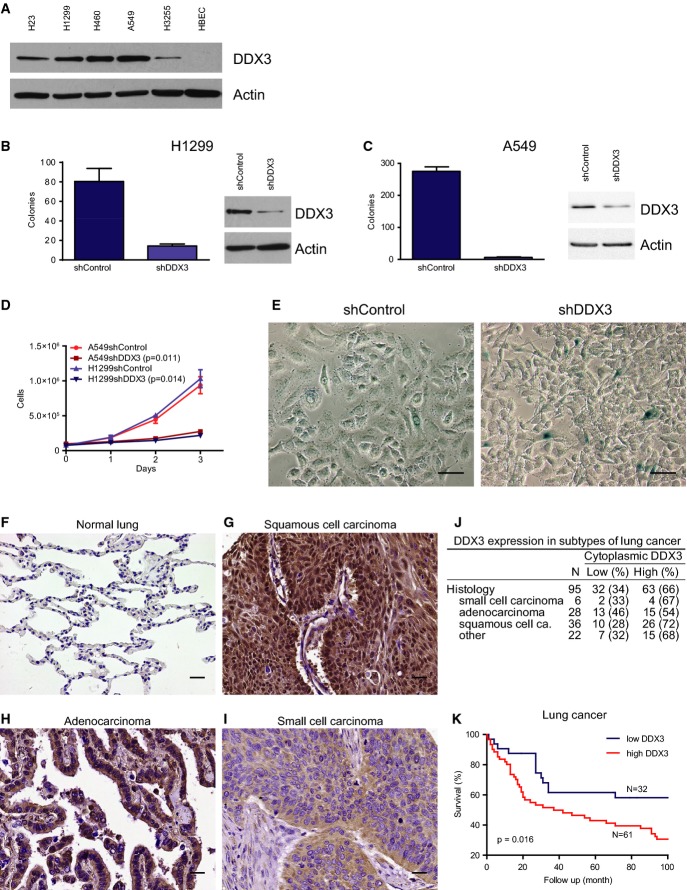
A Immunoblot of DDX3 expression in lung cancer cell lines.
B, C Colony-forming assays in H1299 (B) and A549 (C) lung cancer cells after knockdown by shRNA lentiviral constructs designed against DDX3 or vector control. Corresponding immunoblots displaying knockdown levels of DDX3. Mean from 3 replicates with SD.
D Proliferation of A549 and H1299 cells after knockdown of DDX3. Mean from 3 replicates with SD. (A549 P = 0.011, H1299 P = 0.014; exponential curve fit, extra sum of squares F-test).
E β-galactosidase staining in parental A549 cells and A549 DDX3 knockdown cells displaying senescent cells identified by the blue color.
F Expression of DDX3 by immunohistochemistry in normal lung tissue.
G DDX3 expression in squamous cell carcinoma.
H DDX3 expression in adenocarcinoma.
I DDX3 expression in small cell carcinoma.
J Expression of DDX3 in different histological types of lung cancer. All data sets were compared against each other (chi-square test, P = 0.481).
K Survival analysis of lung cancer patients in low and high DDX3 expressing tumors (Kaplan–Meier curve and log-rank test, P = 0.016).
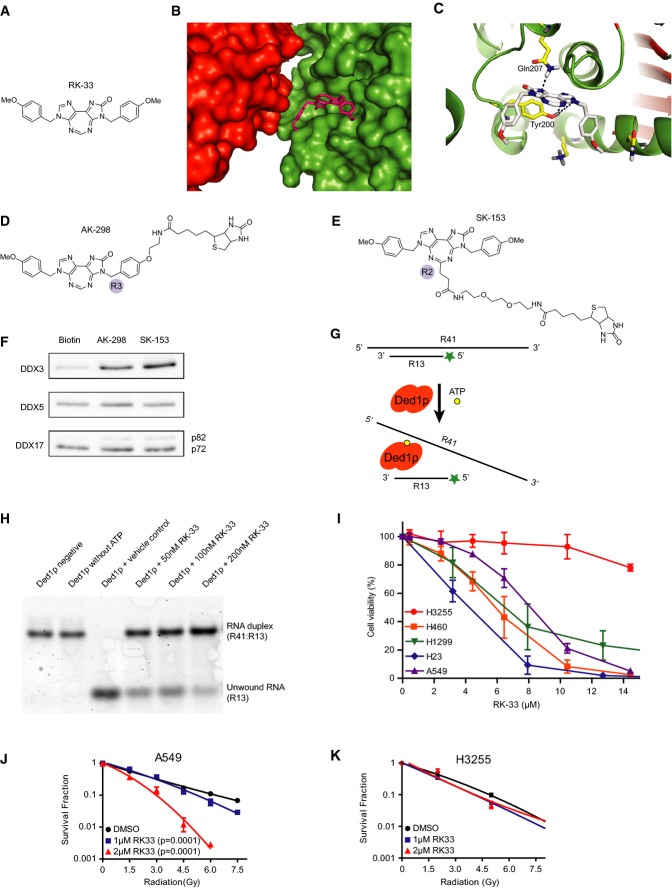
A Chemical structure of RK-33.
B A predicted molecular model of RK-33 docked into the ATP-binding cleft of DDX3. RK-33 is displayed in pink, the surface of the DEADc domain is in green, and the surface of the HELICc domain is in red.
C Hydrogen bond interactions between RK-33 and DDX3. Alpha helices are displayed in green, and β-sheets are shown in maroon.
D, E Chemical structures of biotin-linked RK-33 at R3 position with ethylene amine linker (AK-298) and biotin-labeled RK-33 at R2 position with (PEG)2 ethylene amide linker (SK-153). The two structural differences of AK-298 and SK-153 are the length of the biotin linker and attachment position at RK-33.
F Immunoblots of pull-down assay of DDX3 with biotin, AK-298, and SK-153. Lower panels display results using DDX5 and DDX17 antibodies.
G Schematic representation of helicase assay.
H Immunoblot displaying increasing concentrations of RK-33 (50, 100, 200 nM) resulting in increased inhibition of unwinding of oligomer products (lanes 4–6).
I MTS viability assay of various lung cancer cell lines treated with RK-33 for 72 h. Mean from 3 replicates with SD.
J, K Colony-forming assay of A549 and H3255 cells treated with RK-33 and with various doses of radiation 4 h later. Curves were fitted with a quadratic polynomial equation. Mean from 2 replicates with SD. P-values were determined by the extra sum of squares F-test.
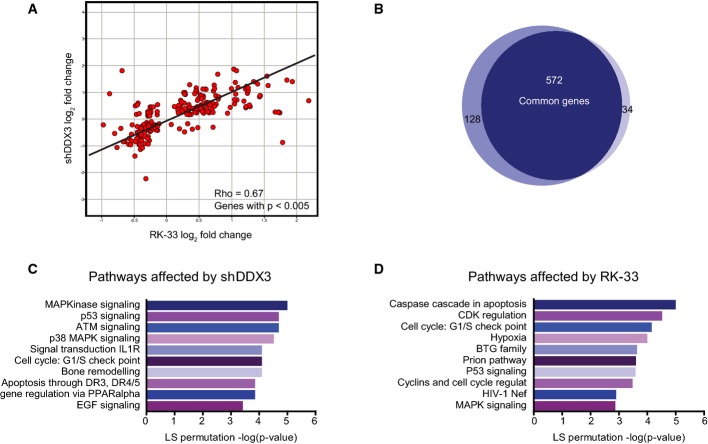
A Scatter plot of the gene expression log2 fold change in DDX3 knockdown and RK-33-treated MDA-MB-231 cells. Each red dot represents a gene, which was significantly perturbed after treatment with RK-33 and after knockdown of DDX3.
B The Venn diagram depicts the number of common genes dysregulated by both shDDX3 and RK-33 treatments.
C, D BioCarta pathway analysis of gene expression in DDX3 knockdown and RK-33-treated cells. Pathways are ranked on LS permutation P-values from top to bottom.
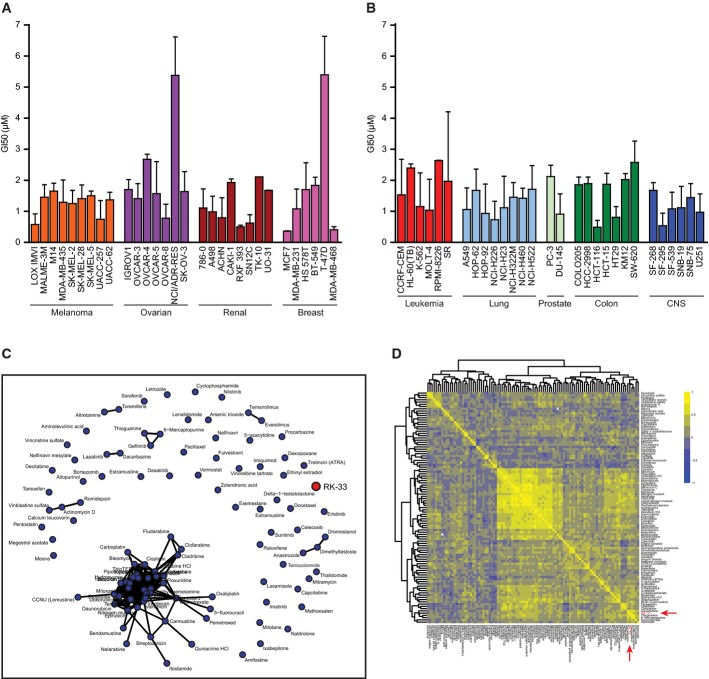
A, B The graph depicts the growth inhibitory properties (GI50) of RK-33 for the NCI-60 panel of cell lines. The NCI-60 is a panel of 60 extensively characterized human cell lines derived from nine distinct tumor types: melanoma, ovarian, renal, breast, leukemia, lung, prostate, colon, and CNS.
C Network analysis of 102 FDA-approved drugs and RK-33 based on GI50 in the NCI-60 cell line panel.
D Unsupervised cluster analysis of the 102 FDA-approved drugs based on the correlation structure of the GI50 levels. The result is shown as a symmetric heat map with positive associations depicted in yellow and negative associations shown in blue.
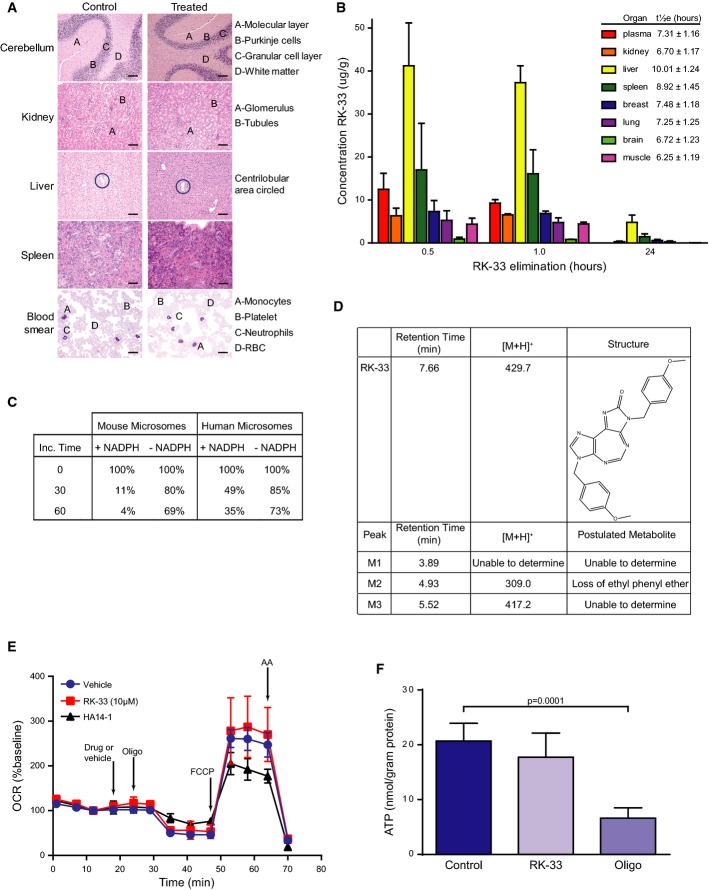
Following injection of 20 mg/kg of RK-33, twice a week for 7 weeks, extensive histopathological examination was carried out following necropsy. Identical patterns were observed both in the control and in the treated mice (n = 2). Samples were stained with H&E. Scale bar is 50 μm.
Pharmacokinetics of RK-33 in SCID mice at various time intervals. Results are mean ± SD from 5 mice. LC-MS/MS method was used to determine concentration of RK-33 in mouse plasma and tissue.
Liquid chromatography–mass spectrometry (LC-MS/MS) analysis was performed to determine different metabolites of RK-33.
RK-33 and metabolites characterized by LC-MS/MS in human liver microsomes using the scan mode function of the LC-MS/MS.
HAPI cells were treated with RK-33 (10 μM), HA14-1 (25 μM), or DMSO vehicle, followed by oligomycin (oligo, 0.5 μg/ml), FCCP (3 μM), and antimycin A (AA, 1 μM) while oxygen consumption rate (OCR) was measured. Pyruvate (10 mM) was added in combination with FCCP to ensure that substrate supply was not rate-limiting for maximal OCR. Data are mean ± SD from 2 to 3 wells and representative of independent experiments performed with two different HAPI passages. OCR is baseline-normalized to the point prior to drug or vehicle addition.
HAPI microglial cells were incubated for 1 h in glucose-free XF24 assay medium that was supplemented with 2-deoxyglucose (50 mM) and pyruvate (10 mM). RK-33 (10 μM), oligomycin (0.5 μg/ml), or vehicle control was additionally present as indicated. Results are mean ± SD from 12 replicates pooled from experiments using two consecutive passages. Significance was assessed by two-sided, unpaired t-test.
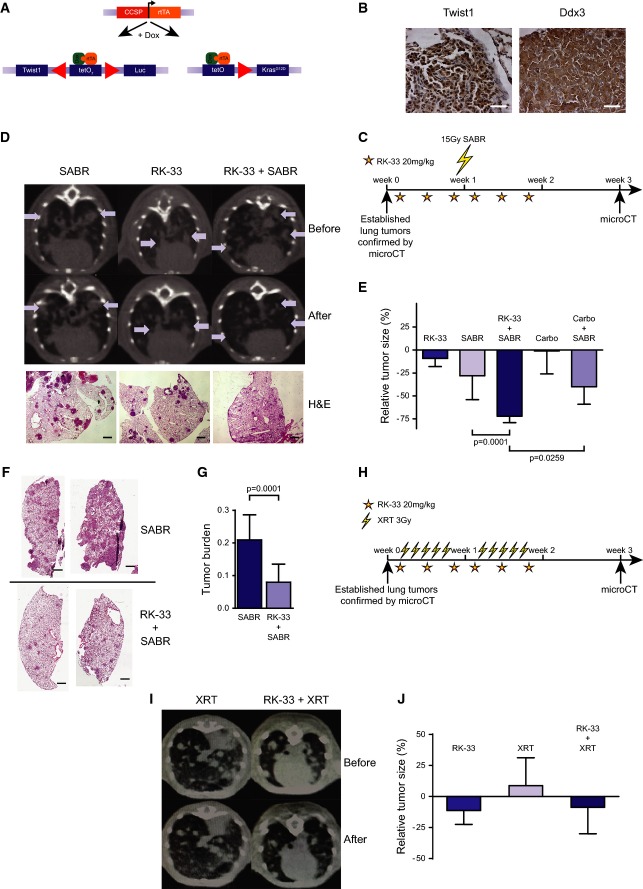
Schematic describing the Twist1/KrasG12D-inducible mouse model.
Confirmation of high expression of Twist1 and DDX3 in the lung tumors of the transgenic Twist1/KrasG12D mouse. Scale bar is 100 μm.
Treatment schedule for mice receiving hypofractionated radiation (SABR). Stars are intraperitoneal (i.p.) injections with RK-33.
Micro-CT images of transgenic Twist1/KrasG12D mice treated as in (C), before treatment and 1 week after treatment. Tumors are indicated by arrows and confirmed by H&E staining of lung sections (lower panel). Scale bar is 250 μm.
Quantification of tumor volume measured by micro-CT in Twist1/KrasG12D mice, as shown in (D). Significance was assessed by two-sided, unpaired t-test. Error bars represent SD.
An orthotopic lung tumor model was generated using A549 human lung cancer cells and treated as in (C). Figure displays H&E staining of lung sections from radiation-treated (upper panel) and RK-33- and radiation-treated mice (lower panel). Scale bar is 2 mm.
Quantification of tumor burden (as tumor surface divided by total lung surface) in orthotopic A549 lung cancer mouse model, as shown in (F). Significance was assessed by two-sided, unpaired t-test. Error bars represent SD.
Treatment schedule for mice receiving fractionated radiation in 10 fractions. Stars indicate i.p. injections with RK-33. Downward lightning bolts indicate 3-Gy radiation fractions.
Micro-CT images of transgenic Twist1/KrasG12D mice treated as in (H), before treatment and 1 week after treatment.
Quantification of tumor volume measured by micro-CT in Twist1/KrasG12D mice, as shown in (I) and expressed as relative tumor size. Significance was assessed by two-sided, unpaired t-test. Error bars represent SEM.
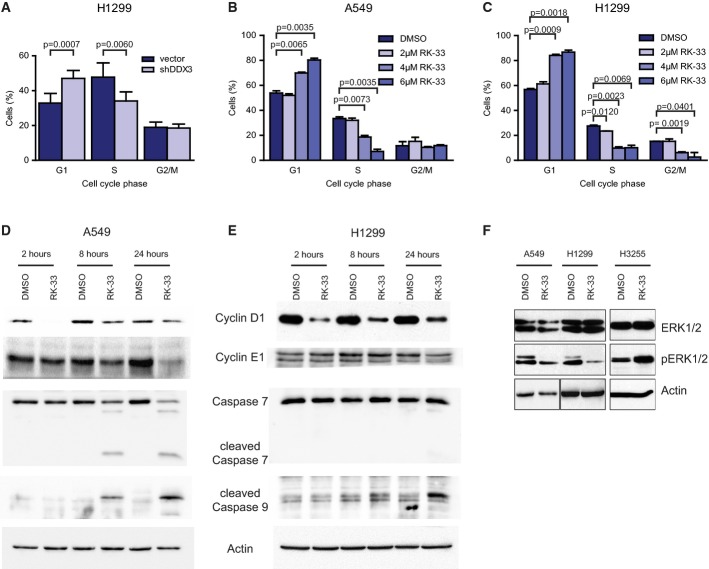
A Cell cycle analysis of H1299 cells treated with shDDX3 and processed by flow cytometry. Knockdown of DDX3 led to a decrease of cells in S-phase and an increase of cells in G1-phase, indicative of a G1 arrest. Significance was assessed by two-sided, unpaired t-test. Error bars represent SD.
B, C Cell cycle analysis of A549 and H1299 cells by flow cytometry after treatment with RK-33 (0, 2, 4, and 6 μM). RK-33 induced a G1 cell cycle arrest in both cell lines. Significance was assessed by two-sided, unpaired t-test. Error bars represent SD.
D, E Immunoblot of cell cycle-related proteins (Cyclin D1 and Cyclin E1) and cell death-related proteins (cleaved caspase 7, cleaved caspase 9) in A549 and H1299 cells after treatment with RK-33 (10 μM). Initially, a strong decrease of Cyclin D1 was observed. After 8 and 24 h, cleaved caspases 9 and 7 were apparent.
F Immunoblot of MAPK pathway-related proteins ERK1/2 and phosphorylated ERK1/2 in A549, H1299, and H3255 (RK-33 resistant) cells 24 h after treatment with RK-33 (7.5 μM or 10 μM). ERK2 and especially ERK1 become dephosphorylated after treatment with RK-33 in A549 and H1299 cells but not in H3255 cells. Outlined boxes indicate spliced lanes.
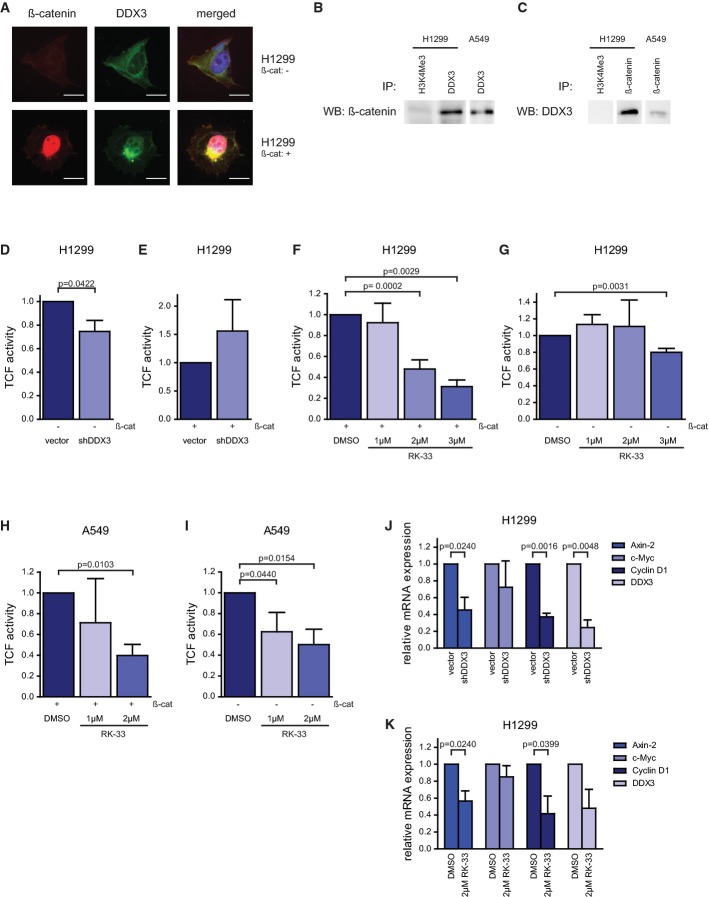
A β-catenin (red) and DDX3 (green) expression in H1299 cells. After overexpressing β-catenin, both DDX3 and β-catenin accumulate in the nucleus. Scale bar is 10 μm.
B Immunoprecipitation with DDX3 or H3K4Me3 (control) and immunoblotted with β-catenin in A549 and H1299 cells. Outlined boxes indicate spliced lanes.
C Immunoprecipitation with β-catenin or H3K4Me3 (control) and immunoblotted with DDX3 in A549 and H1299 cells. Outlined boxes indicate spliced lanes.
D, E β-catenin/TCF4 activity was determined by the TOP/FOP reporter assay. Co-transfection with β-catenin is indicated below.
F–I H1299 and A549 cells were treated with RK-33 (0, 1, 2, and 3 μM) and co-transfected with β-catenin in (F, H). Treatment with RK-33 decreased TCF4 activity in both cell lines.
J, K Normalized mRNA expression of TCF4-regulated proteins (Axin-2, c-Myc, Cyclin D1) and DDX3 were measured by qRT–PCR in H1299 cells after knockdown of DDX3 (J) and treatment with RK-33 (K). All experiments were repeated three times.
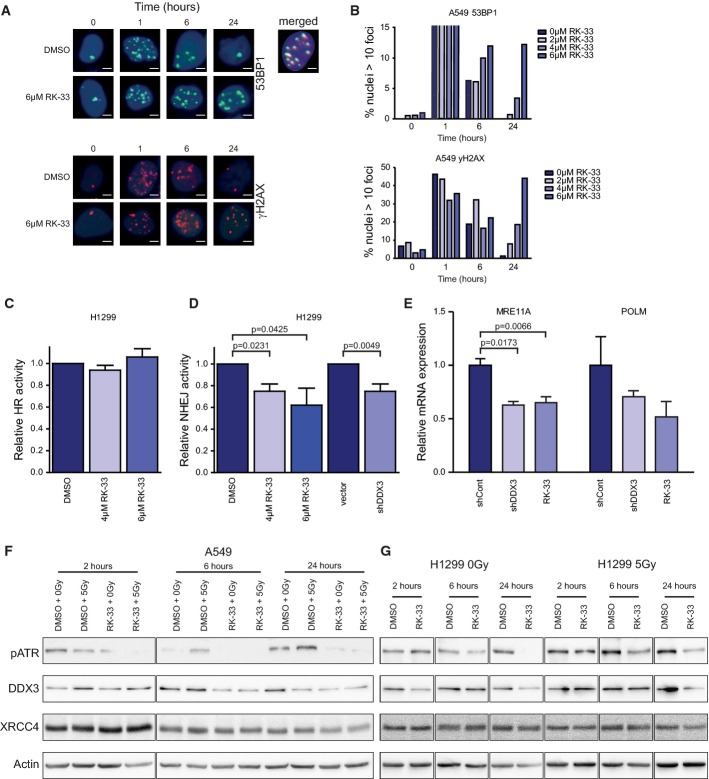
A Immunofluorescence images showing 53BP1 and γH2AX foci in A549 cells after 2-Gy radiation and A549 cells pre-treated with 6 μM RK-33, 12 h before radiation. Overlap of 53BP1 and γH2AX is seen in the merged picture of the co-immunofluorescence staining. Scale bar is 2 μm.
B A549 cells were pre-treated with RK-33 and radiated with 2 Gy, and 53BP1 and γH2AX foci were counted as a measure of DNA damage. Cells with more than 10 foci 53BP1 or γH2AX were counted. More than 400 cells per sample were evaluated.
C H1299 cells stably transfected with a homologous recombination (HR) reporter construct were treated with RK-33. Reporter constructs expressed GFP, which was quantified by flow cytometry. Experiments were repeated three times.
D H1299 cells, containing a stable non-homologous end-joining (NHEJ) reporter construct, were treated with RK-33 and knockdown of DDX3. Reporter construct expressed GFP, which was quantified by flow cytometry. All experiments were repeated three times.
E Microarray results from MDA-MB-231 cells treated with RK-33 and shDDX3 were validated by qRT–PCR using NHEJ Mechanisms of DSBs Repair PrimePCR plates (Bio-Rad) and performed in biological triplicates.
F, G DNA repair-related proteins (ATR and XRCC4), DDX3, and actin were assessed by immunoblotting in A549 (F) and H1299 (G) cells. Cells were pretreated for 4 h with vehicle control or 6 μM RK-33 and then radiated with 0 or 5 Gy. Outlined boxes indicate spliced lanes.
References
-
- Bild AH, Yao G, Chang JT, Wang Q, Potti A, Chasse D, Joshi MB, Harpole D, Lancaster JM, Berchuck A, et al. Oncogenic pathway signatures in human cancers as a guide to targeted therapies. Nature. 2006;439:353–357. - PubMed
Publication types
MeSH terms
Substances
Grants and funding
LinkOut - more resources
Full Text Sources
Other Literature Sources
Medical
