

Metastability in lipid based particles exhibits temporally deterministic and controllable behavior
- PMID: 25820650
- PMCID: PMC4377625
- DOI: 10.1038/srep09481
Metastability in lipid based particles exhibits temporally deterministic and controllable behavior
Abstract
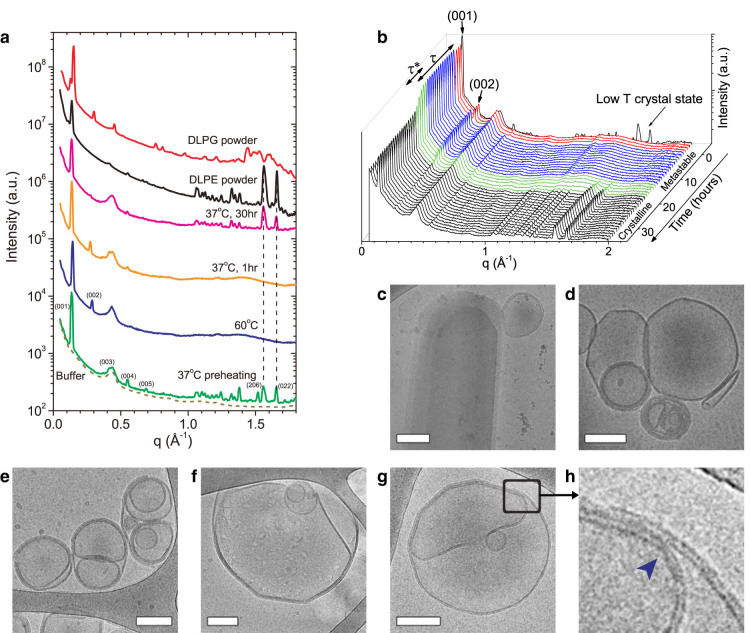
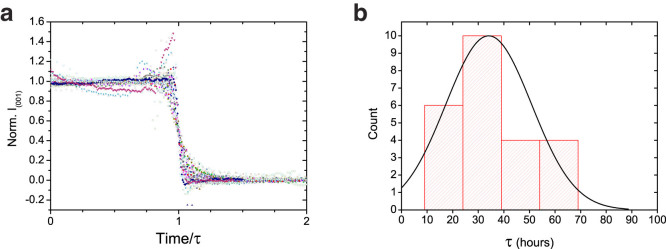
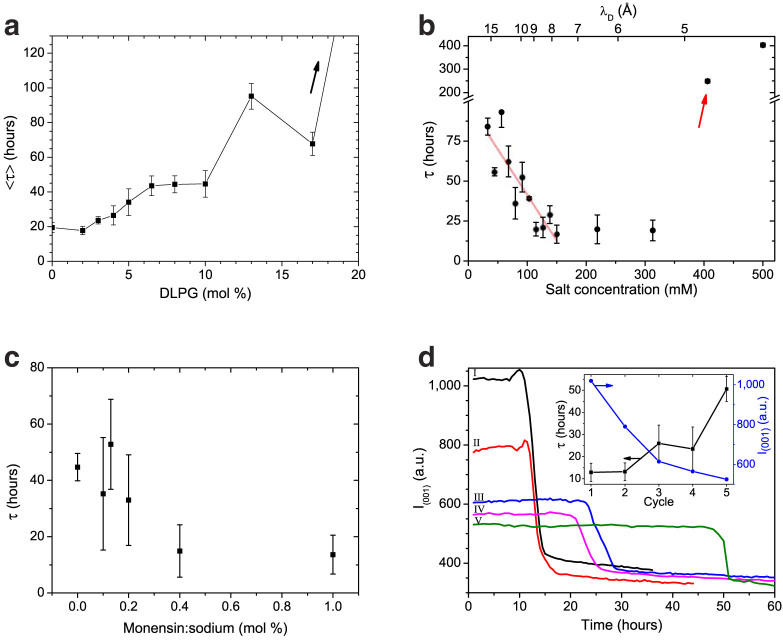
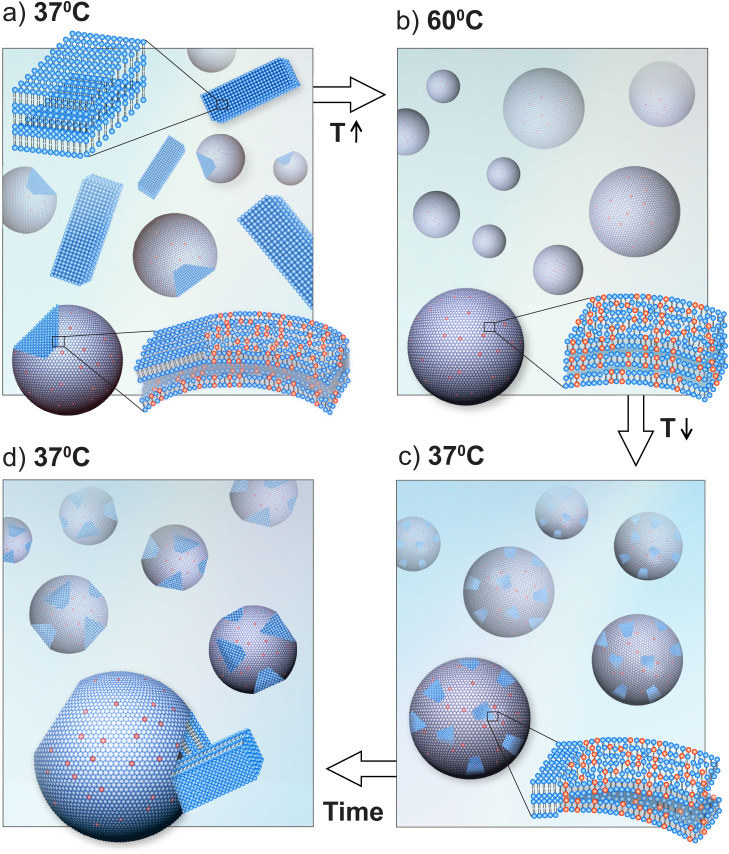
The metastable-to-stable phase-transition is commonly observed in many fields of science, as an uncontrolled independent process, highly sensitive to microscopic fluctuations. In particular, self-assembled lipid suspensions exhibit phase-transitions, where the underlying driving mechanisms and dynamics are not well understood. Here we describe a study of the phase-transition dynamics of lipid-based particles, consisting of mixtures of dilauroylphosphatidylethanolamine (DLPE) and dilauroylphosphatidylglycerol (DLPG), exhibiting a metastable liquid crystalline-to-stable crystalline phase transition upon cooling from 60°C to 37°C. Surprisingly, unlike classically described metastable-to-stable phase transitions, the manner in which recrystallization is delayed by tens of hours is robust, predetermined and controllable. Our results show that the delay time can be manipulated by changing lipid stoichiometry, changing solvent salinity, adding an ionophore, or performing consecutive phase-transitions. Moreover, the delay time distribution indicates a deterministic nature. We suggest that the non-stochastic physical mechanism responsible for the delayed recrystallization involves several rate-affecting processes, resulting in a controllable, non-independent metastability. A qualitative model is proposed to describe the structural reorganization during the phase transition.
Figures
Similar articles
-
Delayed nucleation in lipid particles.Soft Matter. 2020 Jan 7;16(1):247-255. doi: 10.1039/c9sm01834d. Epub 2019 Nov 28. Soft Matter. 2020. PMID: 31777911
-
Thermotropic and barotropic phase transitions of dialkyldimethylammonium bromide bilayer membranes: effect of chain length.Langmuir. 2011 May 17;27(10):5824-31. doi: 10.1021/la200323h. Epub 2011 Apr 26. Langmuir. 2011. PMID: 21520909
-
Hydrostatic pressure reveals bilayer phase behavior of dioctadecyldimethylammonium bromide and chloride.Langmuir. 2011 Mar 1;27(5):1592-8. doi: 10.1021/la104552z. Epub 2011 Jan 25. Langmuir. 2011. PMID: 21261314
-
Self-assembled multicompartment liquid crystalline lipid carriers for protein, peptide, and nucleic acid drug delivery.Acc Chem Res. 2011 Feb 15;44(2):147-56. doi: 10.1021/ar100120v. Epub 2010 Dec 29. Acc Chem Res. 2011. PMID: 21189042 Review.
-
Driving forces of phase transitions in surfactant and lipid systems.J Phys Chem B. 2005 Apr 7;109(13):6430-5. doi: 10.1021/jp045555l. J Phys Chem B. 2005. PMID: 16851716 Review.
Cited by
-
Table-top combined scanning X-ray small angle scattering and transmission microscopies of lipid vesicles dispersed in free-standing gel.RSC Adv. 2020 Dec 23;11(1):484-492. doi: 10.1039/d0ra08581b. eCollection 2020 Dec 21. RSC Adv. 2020. PMID: 35423036 Free PMC article.
-
Glucosylceramide Associated with Gaucher Disease Forms Amyloid-like Twisted Ribbon Fibrils That Induce α-Synuclein Aggregation.ACS Nano. 2021 Jul 27;15(7):11854-11868. doi: 10.1021/acsnano.1c02957. Epub 2021 Jul 2. ACS Nano. 2021. PMID: 34213307 Free PMC article.
-
Angular super-resolution retrieval in small-angle X-ray scattering.Sci Rep. 2020 Sep 29;10(1):16038. doi: 10.1038/s41598-020-73030-2. Sci Rep. 2020. PMID: 32994517 Free PMC article.
-
Considerations for extracellular vesicle and lipoprotein interactions in cell culture assays.J Extracell Vesicles. 2022 Apr;11(4):e12202. doi: 10.1002/jev2.12202. J Extracell Vesicles. 2022. PMID: 35362268 Free PMC article.
-
Liposomes: Structure, Biomedical Applications, and Stability Parameters With Emphasis on Cholesterol.Front Bioeng Biotechnol. 2021 Sep 9;9:705886. doi: 10.3389/fbioe.2021.705886. eCollection 2021. Front Bioeng Biotechnol. 2021. Retraction in: Front Bioeng Biotechnol. 2023 Sep 04;11:1285118. doi: 10.3389/fbioe.2023.1285118. PMID: 34568298 Free PMC article. Retracted. Review.
References
-
- Chaikin P. M. & Lubensky T. C. Principles of Condensed Matter Physics. (Cambridge Univ. Press, Cambridge, 1995).
-
- Tenchov B. On the reversibility of the phase transitions in lipid-water systems. Chem. Phys. Lipids 57, 165–177 (1991). - PubMed
-
- Seddon J. M., Cevc G., Kaye R. D. & Marsh D. X-ray diffraction study of the polymorphism of hydrated diacyl and dialkylphosphatidylethanolamines. Biochemistry 23, 2634–2644 (1984). - PubMed
-
- Seddon J. M., Harlos K. & Marsh D. Metastability and polymorphism in the gel and fluid bilayer phases of dilauroylphosphatidylethanolamine. Two crystalline forms in excess water. J. Biol. Chem. 258, 3850–4 (1983). - PubMed
-
- Chang H. & Epand R. M. The existence of a highly ordered phase in fully hydrated dilauroylphosphatidylethanolamine. Biochim. Biophys. Acta 728, 319–324 (1983). - PubMed
Publication types
MeSH terms
Substances
LinkOut - more resources
Full Text Sources
Other Literature Sources
