Review
. 2015 Mar;56(3):133-44.
doi: 10.11622/smedj.2015040.

Imaging of the spleen: what the clinician needs to know

Affiliations
Review

Imaging of the spleen: what the clinician needs to know

T Vancauwenberghe et al. Singapore Med J. 2015 Mar.

Abstract

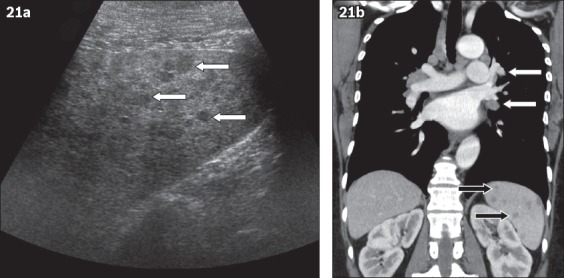
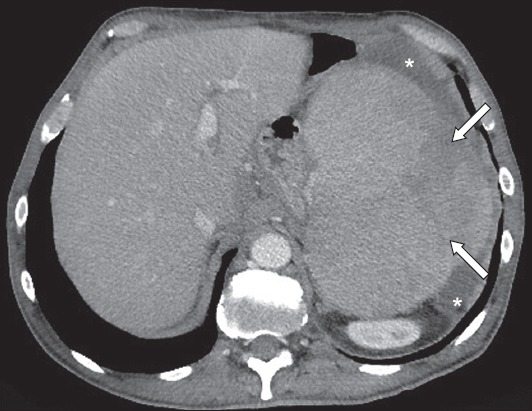
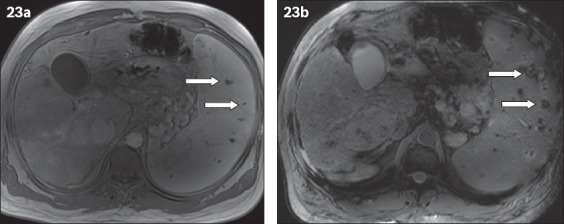
The spleen is considered 'the forgotten organ' among radiologists and clinicians, although it is well visualised on abdominal computed tomography and magnetic resonance imaging. Moreover, the spleen is commonly involved in a wide range of pathologic disorders. These include congenital anomalies, infectious and inflammatory diseases, vascular disorders, benign and malignant tumours, and systemic disorders. In this review, we focus on the key imaging findings of the normal spleen, its variants, as well as relevant congenital and acquired abnormalities. It is of utmost importance to recognise and correctly interpret the variable spectrum of abnormalities that may involve the spleen, in order to avoid unnecessary invasive procedures and to guide adequate treatment.


Figures

Fig. 1
Fig. 1
Normal spleen on US. (a) Coronal and (b) axial views of the left upper quadrant show a normal spleen. The black line represents the splenic width, the white line in (a) represents the splenic length and the white line in (b) indicates the splenic depth.
Fig. 2
Fig. 2
Normal enhancement pattern of the spleen on CT. Axial CT images (a) before and (b & c) after intravenous administration of iodinated contrast material show heterogeneous enhancement of the splenic parenchyma during the arterial phase (as seen in Fig. 2b). (c) In the portal phase, there is homogeneous enhancement.
Fig. 3
Fig. 3
Normal enhancement pattern of the spleen on MR imaging. (a) Fat-suppressed T1-W image shows the spleen (asterisk) as being isointense to slightly hypointense to the muscle. (b) During the arterial phase after intravenous gadolinium contrast enhancement, the spleen shows a serpentine-cordlike pattern. (c) In the portal phase, there is uniform enhancement throughout the spleen.
Fig. 4
Fig. 4
Splenic lobulation. Coronal contrast-enhanced CT image shows a splenic lobule (black arrow) and two clefts more laterally (white arrows).
Fig. 5
Fig. 5
Accessory spleen adjacent to the pancreatic tail, mimicking a pancreatic mass. (a) Axial contrast-enhanced CT; (b) axial T1-W; and (c) T2-W images show a focal mass (arrows) adjacent to the pancreatic tail, with similar signal intensity and enhancement pattern as the spleen, consistent with an accessory spleen.
Fig. 6
Fig. 6
Polysplenia in a 37-year-old woman. Axial contrast-enhanced CT image shows abdominal situs inversus with multiple round splenules (S) in the right upper quadrant, lateral to the stomach. The liver is left-sided and enlarged. The intrahepatic segment of the inferior vena cava (arrow) is on the left of the aorta. Note the slightly enlarged azygous vein (A) and hemiazygous vein (HA).
Fig. 7
Fig. 7
Congenital cyst. (a) US image of a 20-year-old woman with chronic abdominal pain shows a thin-walled anechoic lesion near the splenic hilum (arrow). (b) Axial contrast-enhanced CT image in the same patient shows a round, thin-walled hypodense lesion (arrow).
Fig. 8
Fig. 8
False cyst. Contrast-enhanced CT image shows a cystic unilocular, hypodense splenic mass with wall calcifications (arrow).
Fig. 9
Fig. 9
Cavernous haemangioma. (a) Axial unenhanced CT image shows an amorphous calcification anterior to the spleen (arrow). Axial T1-W images after intravenous administration of gadolinium contrast in the (b) arterial; (c) portovenous; and (d) delayed phases show the calcification to be centrally located in a rounded lesion, representing a cavernous haemangioma. Note the typical irregular peripheral enhancement in the arterial phase, extending in a centripetal manner during the portovenous phase, and pooling in the delayed phase.
Fig. 10
Fig. 10
Lymphangiomatosis. (a) Axial T2-W MR image shows multiple, multilocular cyst-like lesions (arrowheads). (b) T1-W MR image shows the cystic lesions appearing hypointense (arrowheads). (c) T1-W MR image after administration of gadolinium contrast, in the delayed phase, shows enhancement of the septa.
Fig. 11
Fig. 11
Littoral cell angioma in a 35-year-old woman with anaemia and thrombocytopenia. (a) Axial US image of the spleen shows splenomegaly with a focal heterogeneous hyperechoic mass. (b) Axial contrast-enhanced CT image in the portovenous phase confirms an enlarged spleen, containing an irregularly delineated heterogeneous enhancing lesion (asterisk).
Fig. 12
Fig. 12
Multifocal splenic involvement in lymphoma. (a) US image shows several small hypoechoic splenic deposits in a patient with histologically proven mantle cell lymphoma (arrows). (b) Axial contrast-enhanced CT image acquired during the portovenous phase shows multiple low-attenuation lesions within an enlarged spleen (arrowheads). Variation in the size of lesions is more indicative of lymphomatous involvement rather than multifocal abscesses.
Fig. 13
Fig. 13
Splenic involvement in lymphoma. (a) Axial contrast-enhanced CT image acquired during the arterial phase shows a large heterogeneous lesion (asterisk). (b) Axial T1-W image obtained after the administration of gadolinium contrast in the arterial phase shows viable (black arrow) and necrotic (white arrow) parts of the tumour. Note also that the normal parenchyma is almost entirely replaced by the lesion.
Fig. 14
Fig. 14
Peritoneal splenic implant metastases in a patient with metastatic ovarian carcinoma. Axial contrast-enhanced CT image in the portovenous phase shows two well-circumscribed polylobulated and hypodense lesions on the dorsal surface of the spleen (white arrows). Note two more similar lesions on the dorsal surface of the liver (black arrows).
Fig. 15
Fig. 15
Splenic metastatic disease from lung carcinoma. Axial contrast-enhanced (a) CT and (b) T1-W images show two low-attenuation lesions with subtle peripheral enhancement (white arrow). Note a similar lesion posteriorly in the liver (black arrow), representing a liver metastasis.
Fig. 16
Fig. 16
Splenic infarction in a 79-year-old man with known atrial fibrillation. Coronal contrast-enhanced CT image shows a well-demarcated, wedge-shaped region of decreased enhancement with parenchymal loss and retraction of the splenic capsule, indicating the chronic nature of the infarction (arrow).
Fig. 17
Fig. 17
Autosplenectomy in an adult with sickle cell disease. Axial contrast-enhanced CT image shows a small, shrunken spleen, with diffuse calcifications due to repeated micro-infarctions (arrow).
Fig. 18
Fig. 18
Pyogenic abscesses. Axial contrast-enhanced CT image acquired during the portal-venous phase shows multiple irregularly marginated non-enhancing lesions (asterisks).
Fig. 19
Fig. 19
Fungal abscesses. Axial contrast-enhanced CT image acquired during the portal-venous phase shows multiple small non-enhancing splenic foci (white arrows). Note also multiple similar small non-enhancing foci in the liver, representing fungal liver abscesses (black arrows).
Fig. 20
Fig. 20
Splenic tuberculosis. (a) Sagittal US image shows an enlarged spleen with multiple hypoechoic nodules of different sizes (arrows). (b) Contrast-enhanced CT shows widespread hypo-enhancing nodules, representing miliary splenic tuberculosis (arrowheads).
Fig. 21
Fig. 21
Splenic sarcoidosis. (a) US image shows a normal-sized spleen with inhomogeneous echotexture and innumerable small hypoechoic lesions (arrows). (b) Coronal contrast-enhanced CT image acquired during the portovenous phase in a 50-year-old man shows multiple well-defined nodules of decreased enhancement throughout the spleen, representing small non-caseating granulomas (black arrows). Note the mediastinal and hilar adenopathies, which provide clues to the diagnosis (white arrows).
Fig. 22
Fig. 22
Splenomegaly complicated with spontaneous rupture. Axial contrast-enhanced CT image shows free perisplenic fluid (asterisks) and an enlarged spleen with a heterogeneous area (arrows), which represents the area of laceration.
Fig. 23
Fig. 23
Gamna-Gandy bodies in a 68-year-old man with liver cirrhosis and portal hypertension. (a) T1-W MR image obtained after administration of gadolinium contrast shows multiple hypointense foci throughout the spleen, representing haemosiderin (arrows). (b) Gradient-echo T1-W image shows the ‘blooming artefact’ due to the paramagnetic effect of haemosiderin. Note the nodular aspect of the liver parenchyma, which is compatible with cirrhosis.

References

    1. Hilmes MA, Strouse PJ. The pediatric spleen. Semin Ultrasound CT MR. 2007;28:3–11. - PubMed
    1. Vanhoenacker FM, Op de Beeck B, De Schepper AM, et al. Vascular disease of the spleen. Semin Ultrasound CT MR. 2007;28:35–51. - PubMed
    1. Paterson A, Frush DP, Donnelly LF, et al. A pattern-oriented approach to splenic imaging in infants and children. Radiographics. 1999;19:1465–85. - PubMed
    1. Urban BA, Fishman EK. Helical CT of the spleen. AJR Am J Roentgenol. 1998;170:997–1003. - PubMed
    1. Catalano O, Sandomenico F, Vallone P, D’Errico AG, Siani A. Contrast-enhanced sonography of the spleen. Semin Ultrasound CT MR. 2006;27:426–33. - PubMed