

Are vegetation-related roughness changes the cause of the recent decrease in dust emission from the Sahel?
- PMID: 25821264
- PMCID: PMC4373181
- DOI: 10.1002/grl.50273
Are vegetation-related roughness changes the cause of the recent decrease in dust emission from the Sahel?
Abstract
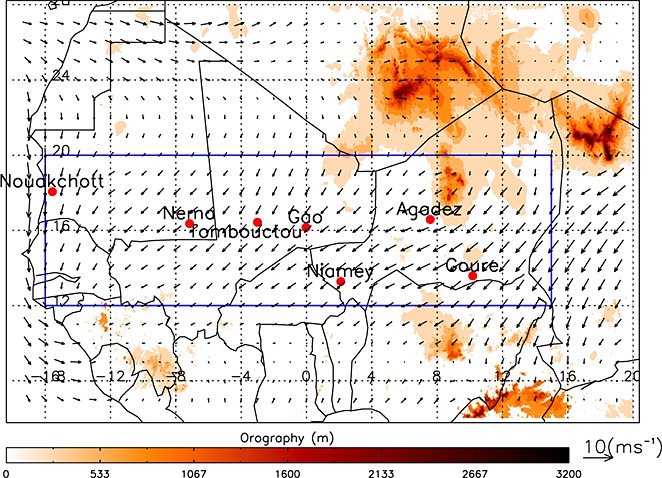
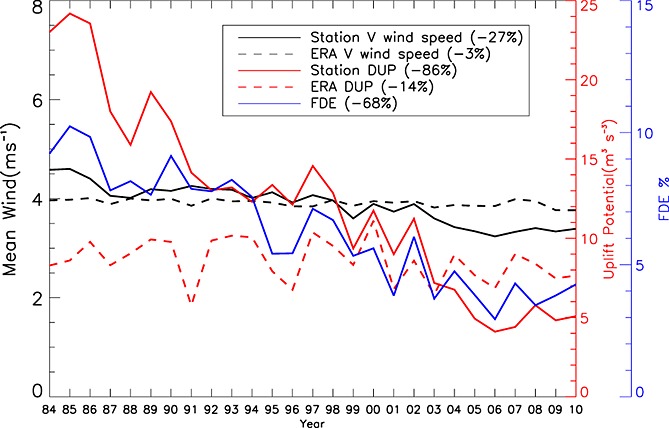
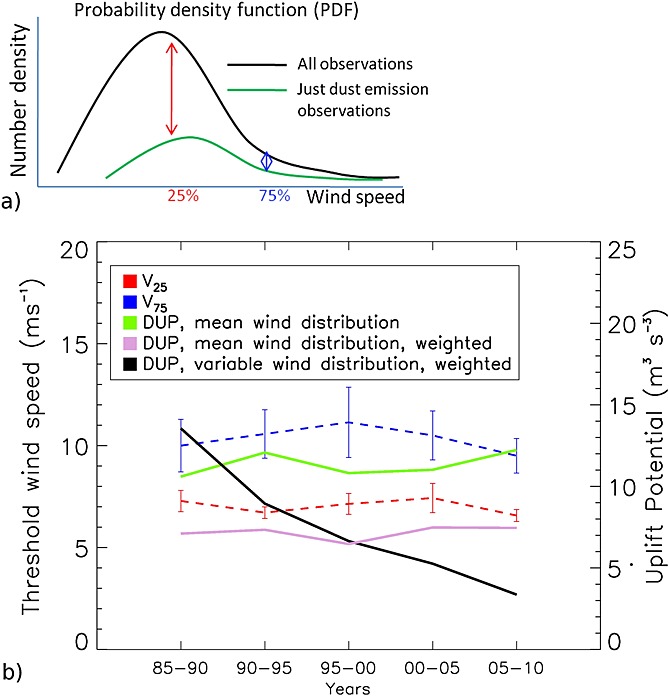
[1] Since the 1980s, a dramatic downward trend in North African dustiness and transport to the tropical Atlantic Ocean has been observed by different data sets and methods. The precise causes of this trend have previously been difficult to understand, partly due to the sparse observational record. Here we show that a decrease in surface wind speeds associated with increased roughness due to more vegetation in the Sahel is the most likely cause of the observed drop in dust emission. Associated changes in turbulence and evapotranspiration, and changes in large-scale circulation, are secondary contributors. Past work has tried to explain negative correlations between North African dust and precipitation through impacts on emission thresholds due to changes in soil moisture and vegetation cover. The use of novel diagnostic tools applied here to long-term surface observations suggests that this is not the dominating effect. Our results are consistent with a recently observed global decrease in surface wind speed, known as "stilling", and demonstrate the importance of representing vegetation-related roughness changes in models. They also offer a new mechanism of how land-use change and agriculture can impact the Sahelian climate. Citation: Cowie, S. M., P. Knippertz, and J. H. Marsham (2013), Are vegetation-related roughness changes the cause of the recent decrease in dust emission from the Sahel?, Geophys. Res. Lett., 40, 1868-1872, doi:10.1002/grl.50273.
Keywords: Sahel; decadal trends; dust emission; roughness length; vegetation; wind-speed.
Figures
References
-
- Ackerman S, Cox S. Surface weather observations of atmospheric dust over the southwest summer monsoon region. Meteorol. Atmos. Phys. 1989;41:19–34. doi: . - DOI
-
- Brindley H, Knippertz P, Ryder C, Ashpole I. A critical evaluation of the ability of the Spinning Enhanced Visible and Infrared Imager (SEVIRI) thermal infrared red-green- blue rendering to identify dust events: Theoretical analysis. J. Geophys. Res. 2012;117 D07201, . - DOI
-
- Chiapello I, Moulin C, Prospero JM. Understanding the long-term variability of African dust transport across the Atlantic as recorded in both Barbados surface concentrations and large-scale Total Ozone Mapping Spectrometer (TOMS) optical thickness. J. Geophys. Res. 2005;110 D18S10, doi: . - DOI
-
- Chomette O, Legrand M, Marticorena B. Determination of the wind-speed threshold for the emission of desert dust using satellite remote sensing in the thermal infrared. J. Geophys. Res. 1999;104:31,207–31,215. doi: . - DOI
-
- Engelstaedter S, Washington R. Atmospheric controls on the annual cycle of North African dust. J. Geophys. Res. 2007;112 D03103, doi: . - DOI
LinkOut - more resources
Full Text Sources
Other Literature Sources
Miscellaneous