. 2013 Nov 12;9(11):5004-5020.
doi: 10.1021/ct4007585. Epub 2013 Oct 15.

On Predicting Mössbauer Parameters of Iron-Containing Molecules with Density-Functional Theory

Affiliations

On Predicting Mössbauer Parameters of Iron-Containing Molecules with Density-Functional Theory

Mátyás Pápai et al. J Chem Theory Comput. .

Abstract

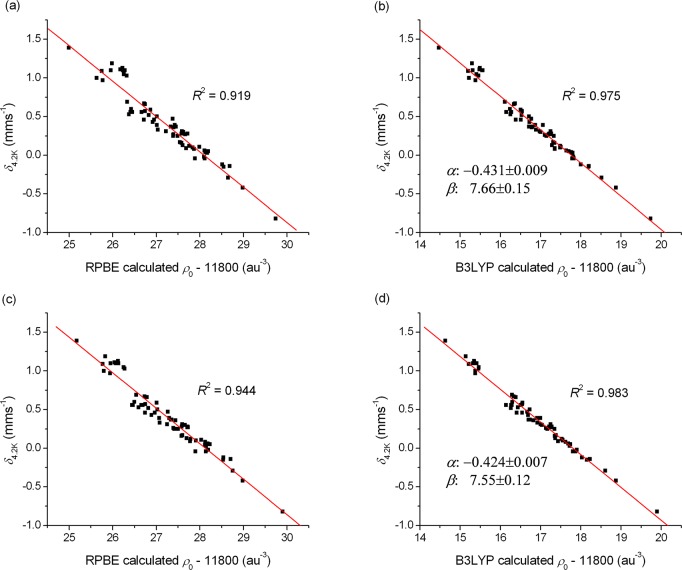
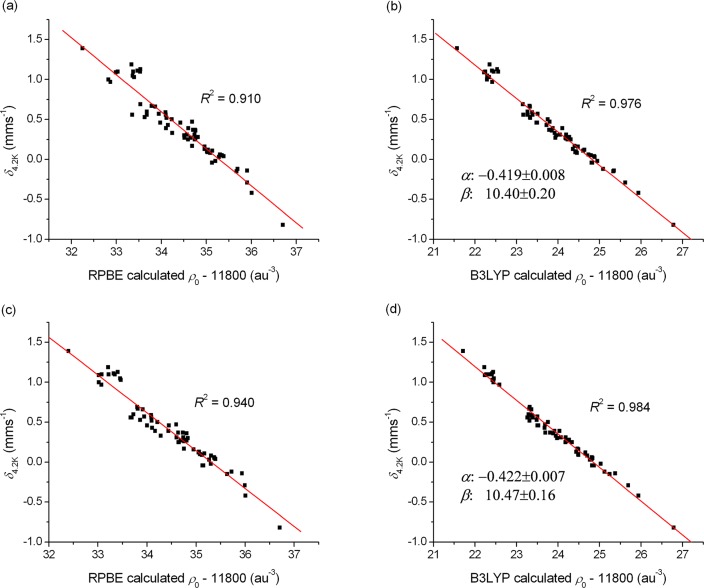
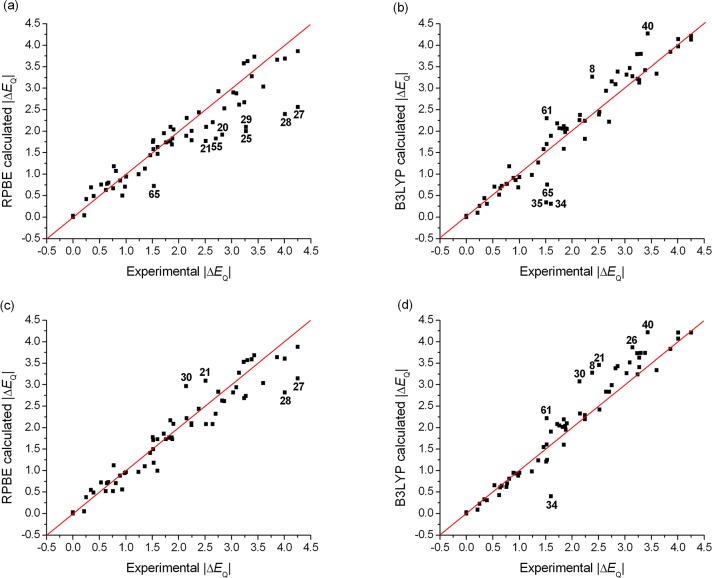
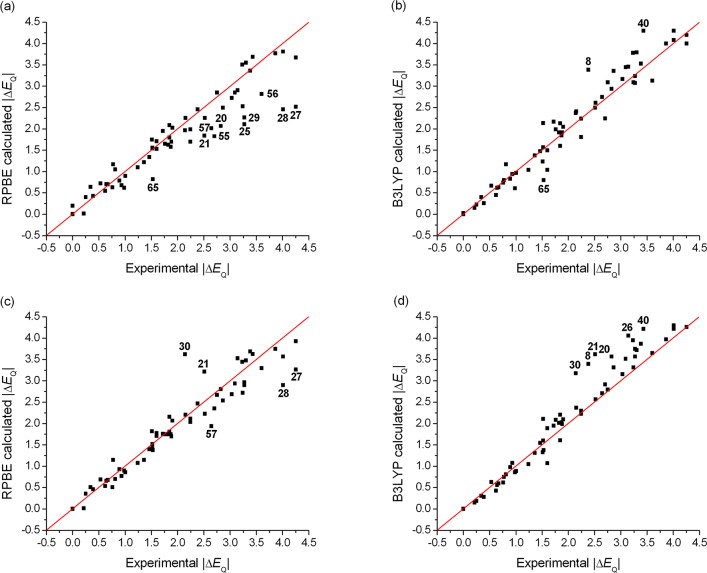
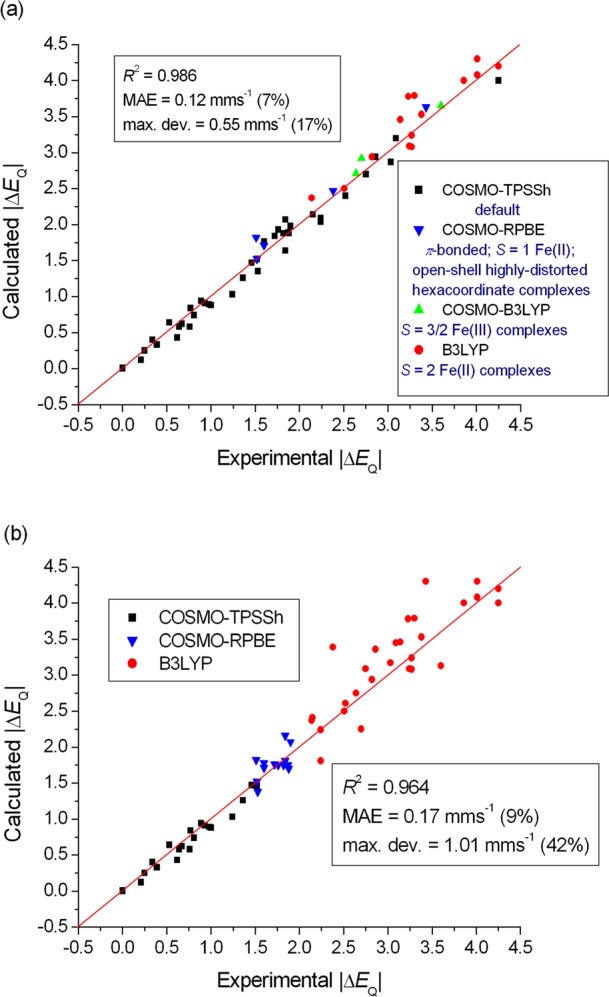
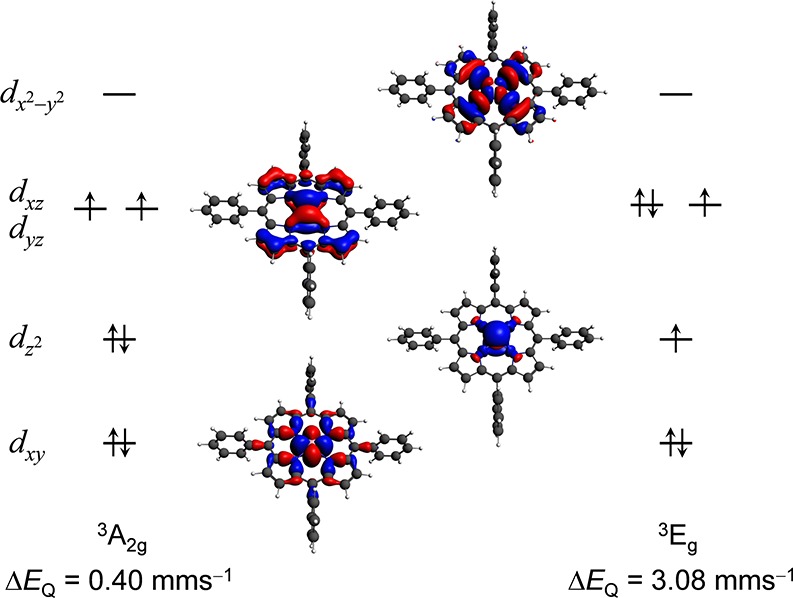
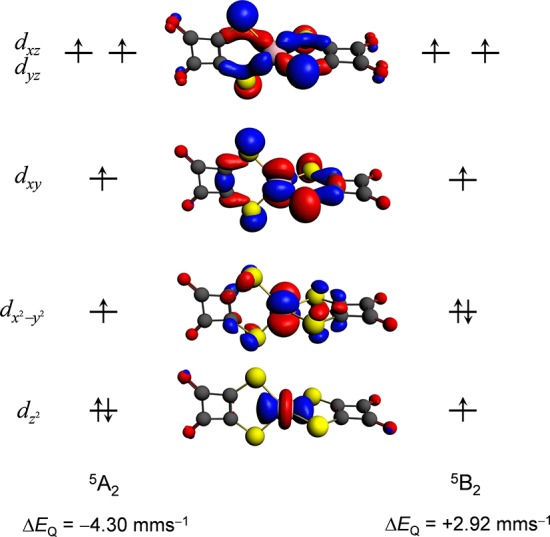
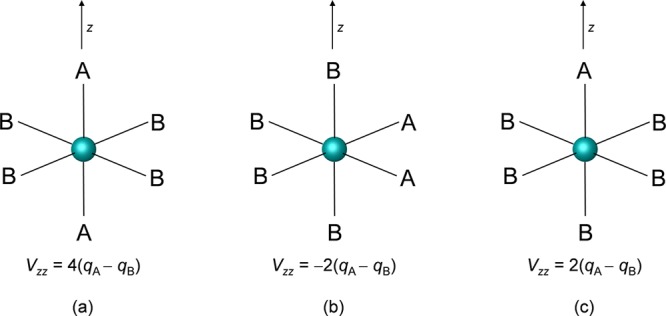
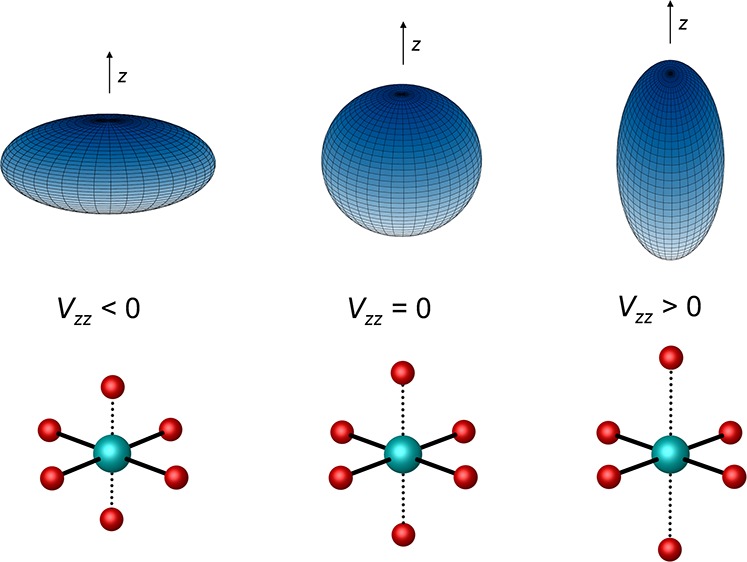
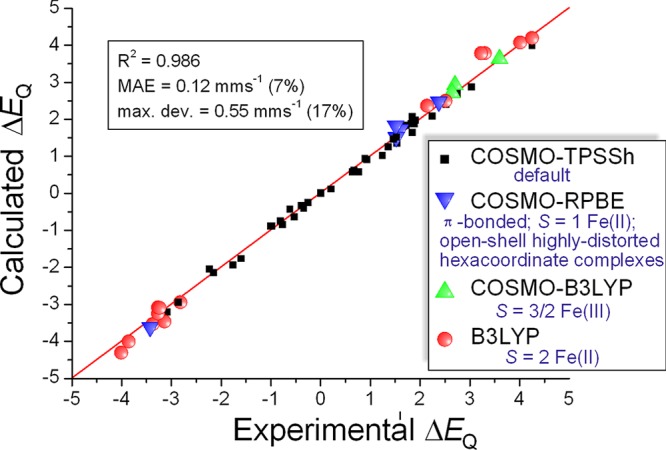
The performance of six frequently used density functional theory (DFT) methods (RPBE, OLYP, TPSS, B3LYP, B3LYP*, and TPSSh) in the prediction of Mössbauer isomer shifts(δ) and quadrupole splittings (ΔEQ) is studied for an extended and diverse set of Fe complexes. In addition to the influence of the applied density functional and the type of the basis set, the effect of the environment of the molecule, approximated with the conducting-like screening solvation model (COSMO) on the computed Mössbauer parameters, is also investigated. For the isomer shifts the COSMO-B3LYP method is found to provide accurate δ values for all 66 investigated complexes, with a mean absolute error (MAE) of 0.05 mm s-1 and a maximum deviation of 0.12 mm s-1. Obtaining accurate ΔEQ values presents a bigger challenge; however, with the selection of an appropriate DFT method, a reasonable agreement can be achieved between experiment and theory. Identifying the various chemical classes of compounds that need different treatment allowed us to construct a recipe for ΔEQ calculations; the application of this approach yields a MAE of 0.12 mm s-1 (7% error) and a maximum deviation of 0.55 mm s-1 (17% error). This accuracy should be sufficient for most chemical problems that concern Fe complexes. Furthermore, the reliability of the DFT approach is verified by extending the investigation to chemically relevant case studies which include geometric isomerism, phase transitions induced by variations of the electronic structure (e.g., spin crossover and inversion of the orbital ground state), and the description of electronically degenerate triplet and quintet states. Finally, the immense and often unexploited potential of utilizing the sign of the ΔEQ in characterizing distortions or in identifying the appropriate electronic state at the assignment of the spectral lines is also shown.


Figures

Figure 1
Figure 1
Linear correlations between the (a) RPBE, (b) B3LYP, (c) COSMO-RPBE, (d) COSMO-B3LYP (in combination with the GTO-CP(PPP) basis set) calculated electron density (ρ0) at the 57Fe nucleus and the corrected experimental isomer shift (δ4.2K). The fitting parameters are indicated for the B3LYP method; for all other applied DFT methods the results are shown in the SI.
Figure 2
Figure 2
Linear correlations between the (a) RPBE, (b) B3LYP, (c) COSMO-RPBE, (d) COSMO-B3LYP (in combination with the STO–TZP basis set) calculated electron density (ρ0) at the 57Fe nucleus and the corrected experimental isomer shift (δ4.2K). The fitting parameters are indicated for the B3LYP method; for all other applied DFT methods the results are shown in the SI.
Figure 3
Figure 3
Comparison of experimental and (a) RPBE, (b) B3LYP, (c) COSMO-RPBE, (d) COSMO-B3LYP (in combination with the GTO-CP(PPP) basis set) calculated quadrupole splittings (ΔEQ). The red line connects the ΔEQ(exp.) = ΔEQ(calc.) points. The largest outliers can be identified by the numbers defined in Table 1. Correlations for all the other applied DFT methods are shown in the SI.
Figure 4
Figure 4
Comparison of experimental and (a) RPBE, (b) B3LYP, (c) COSMO-RPBE, (d) COSMO-B3LYP (in combination with the STO-TZP basis set) calculated quadrupole splittings (ΔEQ). The red line was drawn at ΔEQ(exp.) = ΔEQ(calc.). The largest outliers can be identified by the numbers defined in Table 1. Correlations for all the other applied DFT methods are shown in the SI.
Figure 5
Figure 5
Comparison of experimental and DFT-calculated quadrupole splittings (ΔEQ), applying exchange-correlation functionals for different (a) chemical classes of Fe complexes and (b) ranges of experimental ΔEQ (in combination with the STO-TZP basis set). The red line was drawn at ΔEQ(exp.) = ΔEQ(calc.).
Figure 6
Figure 6
Schematic representation of the electronic configurations and the 3D illustration of the DFT Fe-3d orbitals of the triplet 3A2g and 3Eg (D4h) states of Fe(TPP) (35). Note that for the sake of simplicity we do not show spin-polarized energy levels and we only show one component of the degenerate dxz, dyz orbitals and 3Eg states. The given ΔEQ values were computed at the B3LYP/STO-TZP level of theory and are to be compared with the experimental value of 1.51 mm s–1.
Figure 7
Figure 7
Schematic representation of the electronic configurations and the 3D illustration of the DFT Fe-3d orbitals of the quintet 5A2 and 5B2 states of [Fe(DTSQ)2]2– (23). Note that for the sake of simplicity we do not show spin-polarized energy levels and that we only show one component of the degenerate dxz, dyz orbitals. The given ΔEQ values were computed at the B3LYP/STO-TZP level of theory and are to be compared with the experimental value of −4.01 mm s–1.
Figure 8
Figure 8
3D representation of the structures of the octahedral (a) trans-FeA2B4, (b) cis-FeA2B4, and (c) FeAB5 complexes. Parametric Vzz values expected from the point charge model are also shown. The orientation of the z axis was chosen to be the principal axis.
Figure 9
Figure 9
Illustration of the sign of the EFG for a distorted spherical charge distribution (top) and for Fe complexes with Oh symmetry (bottom). In case of a negative (respectively positive) Vzz, the charge distribution around the Fe nucleus is represented as an oblate (respectively prolate) spheroid, while the complex undergoes a tetragonal distortion by being compressed (respectively stretched) along the principal z axis. Note that a zero Vzz corresponds to a fully symmetric system with an undistorted charge distribution, represented by a sphere, or equal bond lengths for the Oh case.
Figure 10
Figure 10
Comparison of experimental and DFT-calculated quadrupole splittings (ΔEQ), applying exchange-correlation functionals for different chemical classes of Fe complexes and using the sign of ΔEQ as described in the text above.

References

    1. Mössbauer R. L. Z. Phys. 1958, 151, 124–143.
    1. Greenwood N. N.; Gibb T. C.. Mössbauer Spectroscopy; Chapman and Hall: London, 1971.
    1. Vértes A.; Korecz L.; Burger K.. Mössbauer Spectroscopy; Elsevier Scientific Publishing Company: Amsterdam–Oxford–New York, 1979.
    1. Gütlich P.; Bill E.; Trautwein A. X.. Mössbauer Spectroscopy and Transition Metal Chemistry; Springer: Heidelberg–Dordrecht–London–New York, 2011.
    1. Hastings J. B.; Siddons D. P; van Bürck U.; Hollatz R.; Bergmann U. Phys. Rev. Lett. 1991, 66, 770–773. - PubMed
    2. Seto M.; Yoda Y.; Kikuta S.; Zhang X. W.; Ando M. Phys. Rev. Lett. 1995, 74, 3828–3831. - PubMed
    3. Sturhahn W.; Alp E. E.; Toellner T. S.; Hession P.; Hu M.; Sutter J. Hyperfine Interact. 1998, 113, 47–58.
    4. Rüffer R.; Chumakov A. I. Hyperfine Interact. 2000, 128, 255–272.
    5. Sergueev I.; van Bürck U.; Chumakov A. I.; Asthalter T.; Smirnov G. V.; Franz H.; Rüffer R.; Petry W. Phys. Rev. B 2006, 73, 24203.
    6. Potapkin V.; Chumakov A. I.; Smirnov G. V.; Celse J. P.; Rüffer R.; McCammon C.; Dubrovinsky L. J. Synchrotron Radiat. 2012, 19, 559–569. - PubMed

LinkOut - more resources