. 2015 Mar 5;7(1):22.
doi: 10.1186/s13073-015-0142-6. eCollection 2015.

Activation of an endogenous retrovirus-associated long non-coding RNA in human adenocarcinoma

Affiliations

Activation of an endogenous retrovirus-associated long non-coding RNA in human adenocarcinoma

Ewan A Gibb et al. Genome Med. .

Abstract

Background: Long non-coding RNAs (lncRNAs) are emerging as molecules that significantly impact many cellular processes and have been associated with almost every human cancer. Compared to protein-coding genes, lncRNA genes are often associated with transposable elements, particularly with endogenous retroviral elements (ERVs). ERVs can have potentially deleterious effects on genome structure and function, so these elements are typically silenced in normal somatic tissues, albeit with varying efficiency. The aberrant regulation of ERVs associated with lncRNAs (ERV-lncRNAs), coupled with the diverse range of lncRNA functions, creates significant potential for ERV-lncRNAs to impact cancer biology.

Methods: We used RNA-seq analysis to identify and profile the expression of a novel lncRNA in six large cohorts, including over 7,500 samples from The Cancer Genome Atlas (TCGA).

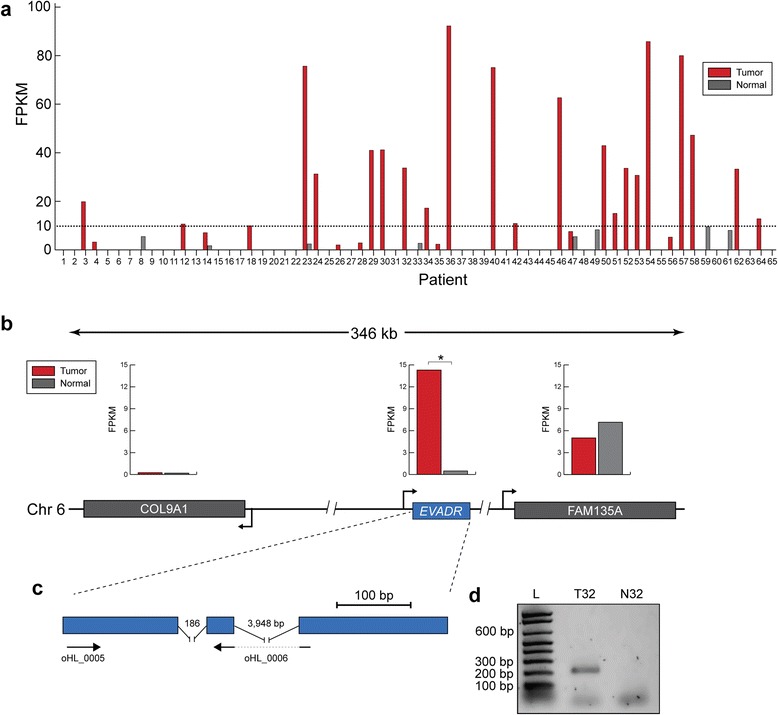
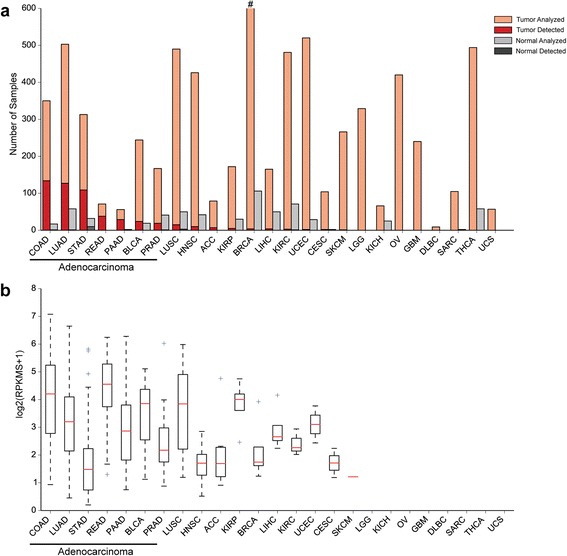
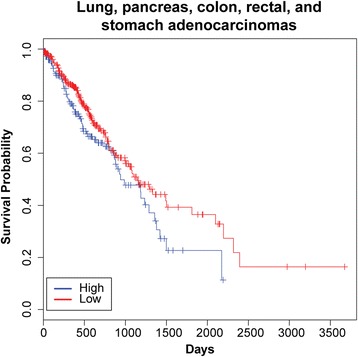
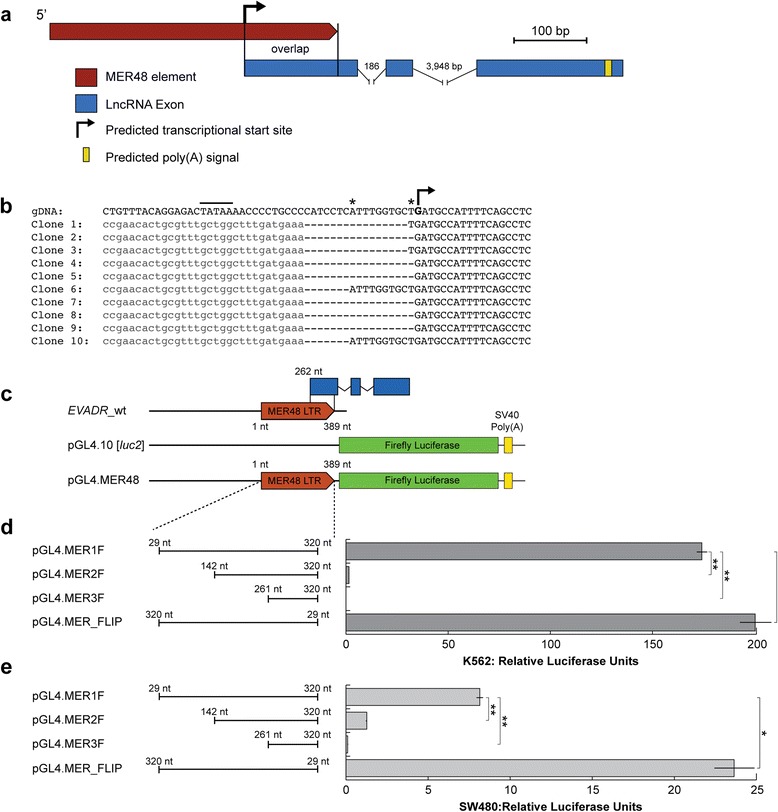
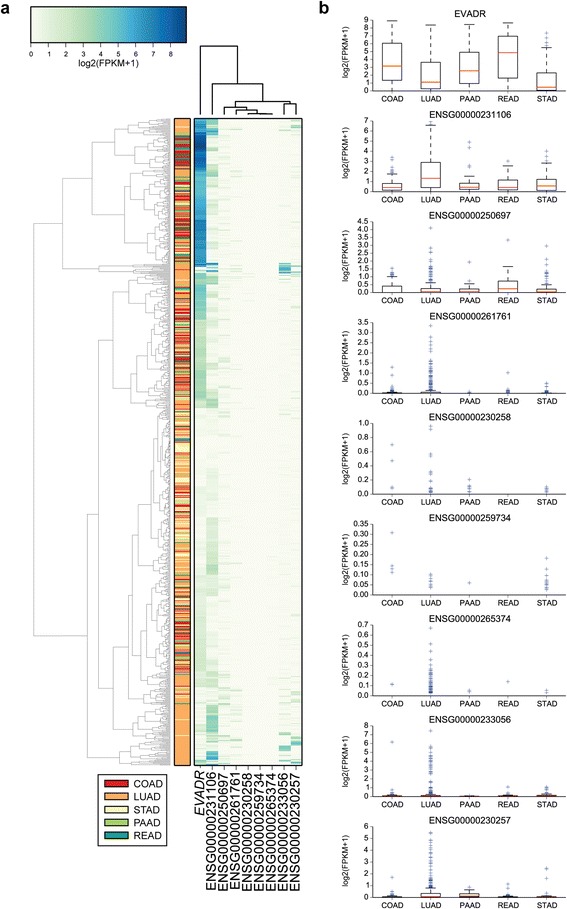
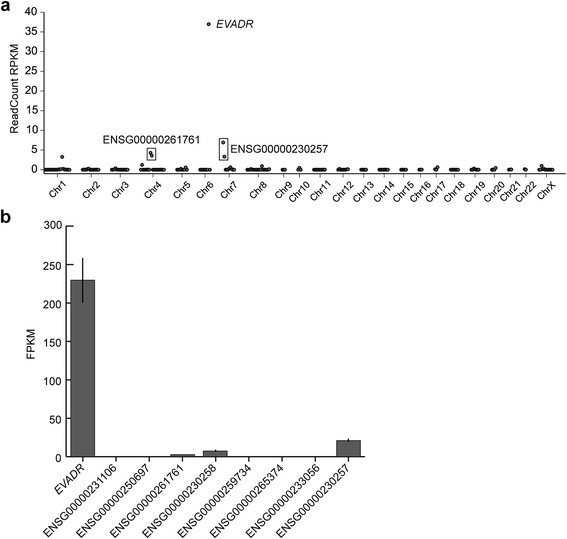
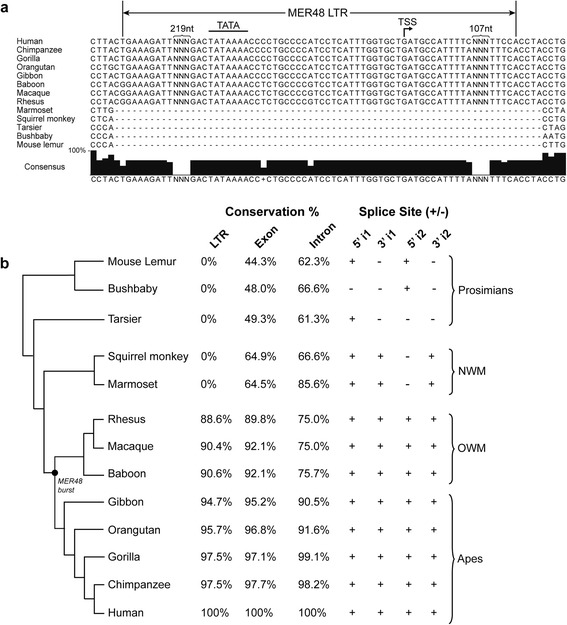
Results: We identified the tumor-specific expression of a novel lncRNA that we have named Endogenous retroViral-associated ADenocarcinoma RNA or 'EVADR', by analyzing RNA-seq data derived from colorectal tumors and matched normal control tissues. Subsequent analysis of TCGA RNA-seq data revealed the striking association of EVADR with adenocarcinomas, which are tumors of glandular origin. Moderate to high levels of EVADR were detected in 25 to 53% of colon, rectal, lung, pancreas and stomach adenocarcinomas (mean = 30 to 144 FPKM), and EVADR expression correlated with decreased patient survival (Cox regression; hazard ratio = 1.47, 95% confidence interval = 1.06 to 2.04, P = 0.02). In tumor sites of non-glandular origin, EVADR expression was detectable at only very low levels and in less than 10% of patients. For EVADR, a MER48 ERV element provides an active promoter to drive its transcription. Genome-wide, MER48 insertions are associated with nine lncRNAs, but none of the MER48-associated lncRNAs other than EVADR were consistently expressed in adenocarcinomas, demonstrating the specific activation of EVADR. The sequence and structure of the EVADR locus is highly conserved among Old World monkeys and apes but not New World monkeys or prosimians, where the MER48 insertion is absent. Conservation of the EVADR locus suggests a functional role for this novel lncRNA in humans and our closest primate relatives.

Conclusions: Our results describe the specific activation of a highly conserved ERV-lncRNA in numerous cancers of glandular origin, a finding with diagnostic, prognostic and therapeutic implications.


Figures

Figure 1
Figure 1
A long non-coding RNA is highly activated in colorectal tumors. (a) Expression of EVADR in tumor and adjacent normal tissue from 65 patients with colorectal carcinoma. For each subject (x-axis) tumor is shown in red and normal tissue in grey. The dashed line indicates an arbitrary minimum expression threshold of 10 FPKM. A total of 21 patients demonstrated robust (>10 FPKM) levels of EVADR expression. Normal colon tissue was generally not found to express EVADR or it was expressed at low levels (<10 FPKM). (b) Schematic representation of the chromosomal location of the EVADR gene locus. Arrowheads indicate the orientation of transcription. Bar plots indicate mean expression levels for respective genes across all 65 tumor (COL91A, 0.25 ± 1.11 FPKM; EVADR, 14.4 ± 24.5 FPKM; FAM135A, 7.2 ± 3 FPKM (mean ± SD)) and normal samples (COL91A, 0.19 ± 0.53 FPKM; EVADR, 0.50 ± 1.52 FPKM; FAM135A, 5 ± 2.6 FPKM (mean ± SD)). *P < 0.00001; paired t-test. (c) Exon structure and primer locations for the lncRNA EVADR. (d) Representative gel image showing EVADR transcript levels in colorectal tumor (T32) and matched normal (N32) tissue samples for patient 32, measured by RT-PCR. The letter L indicates the molecular ladder.
Figure 2
Figure 2
EVADR is robustly expressed in adenocarcinomas. (a) EVADR expression in 25 TCGA cancer types and corresponding normal tissues. Light orange indicates the tumors analyzed and light grey indicates normal samples analyzed. The hashtag (#) indicates that 916 BRCA samples were analyzed. Dark red indicates the number of adenocarcinoma samples in which EVADR expression was detected, while dark grey indicates the number of normal samples in which EVADR was detected. (b) EVADR expression as log2(RPKMS + 1), determined for tumors using TASR. Medians are indicated by red lines, upper and lower quartiles by the boxes, and outliers by blue crosses. COAD, colon adenocarcinoma; LUAD, lung adenocarcinoma; STAD, stomach adenocarcinoma; READ, rectum adenocarcinoma; PAAD, pancreatic adenocarcinoma; BLCA, bladder urothelial carcinoma; PRAD, prostate adenocarcinoma; LUSC, lung squamous cell carcinoma; HNSC, head and neck squamous cell carcinoma; ACC, adrenocortical carcinoma; KIRP, kidney renal papillary cell carcinoma; BRCA, breast invasive carcinoma; LIHC, liver hepatocellular carcinoma; KIRC, kidney renal clear cell carcinoma; UCEC, uterine corpus endometrial carcinoma; CESC, cervical squamous cell carcinoma and endocervical adenocarcinoma; SKCM, skin cutaneous melanoma; LGG, brain lower grade glioma; KICH, kidney chromophobe; OV, ovarian serous cystadenocarcinoma; GBM, glioblastoma multiforme; DLBC, lymphoid neoplasm diffuse large B-cell lymphoma; SARC, sarcoma; THCA, thyroid carcinoma; UCS, uterine carcinosarcoma.
Figure 3
Figure 3
Overall survival decreases for adenocarcinoma patients expressing EVADR . Kaplan-Meier curves were constructed using a univariate Cox analysis, stratifying patients based on EVADR levels in tumor, with patients expressing high (>5.6 FPKM) levels of EVADR showing decreased survival when compared with those with low (<5.6 FPKM) expression (hazard ratio = 1.47, 95% confidence interval = 1.06 to 2.04, P = 0.02). Tick marks on the graph denote the last time survival status was known for living patients.
Figure 4
Figure 4
The lncRNA EVADR is partially derived from a MER48 ERV element. (a) Gene structure indicating the MER48 element overlapping with the 5′ termini of EVADR (red); lncRNA exons are shown in blue, predicted poly(A) signal in yellow and the promoter by a bent arrowhead. (b) Partial sequences of 10 clones from 5′ RNA ligase-mediated RACE analysis of MER48 initiated EVADR transcripts aligned to human genomic DNA. The predicted TATA box is indicated by a line, the minor transcriptional start sites by an asterisk, and the predominant initiating nucleotide is bolded and indicated by a bent arrow. The RNA adaptor sequences are light grey and in lower case. (c) Promoter deletion experimental design showing truncations of the MER48 element. The MER48 LTR is indicated by a red arrow, the luciferase ORF by green rectangles, and EVADR is indicated by blue rectangles. (d) Results of the promoter analysis in K562 cells. (e) Results of the promoter analysis in SW480 cells. *Adjusted P < 0.05; **adjusted P < 0.005; two-sample t-test with Bonferroni correction.
Figure 5
Figure 5
MER48 activation is specific, rather than general, in adenocarcinoma tumors. (a) Clustered heatmap showing the expression of nine MER48-associated lncRNAs in a panel of colon (COAD; n = 181), rectal (READ; n = 66), pancreatic (PAAD; n = 52), lung (LUAD; n = 372) and stomach (STAD; n = 136) adenocarcinomas. (b) Expression levels for the same nine MER48-lncRNAs. The y-axis is log2(FPKM + 1) for each set. Medians are indicated by red lines, upper and lower quartiles by boxes, and outliers by blue crosses.
Figure 6
Figure 6
MER48 LTRs are not globally active in K562 cells. (a) Scatterplot of expression for 201 reliable MER48 elements in K562, with EVADR being the highest expressed MER48 element. Plotted values are the average of two experiments. (b) Expression of the nine MER48-lncRNAs in K562s in a validation dataset. Values are the average of three experiments. The ENSG00000230257 is driven by a MER48 element flanking a HERVH48 insertion. The ENSG00000261761 lncRNA MER48 is split by an Alu insertion. The lncRNA ENSG00000230258 is associated with an unreliable MER48 in Dfam [41] and was not, therefore, part of the list used for the scatterplot and does not appear in these data.
Figure 7
Figure 7
Sequence conservation of the EVADR lncRNA in primates. (a) Partial sequence alignment of the EVADR MER48 and flanking sequence in 13 primates showing lack of MER48 LTR in NWMs and prosimians. The major experimentally determined transcriptional start site (TSS) is indicated by a bent arrow, while the predicted TATA box is indicated by a line. Due to space constraints, some sequence has been removed and is indicated by NNN and curly brackets. (b) Sequence identity of the EVADR MER48 LTR and EVADR in 13 primate species determined with SIAS (Methods) on ClustalW aligned sequences. The first and second introns are indicated by an i1 and i2, respectively. The tree was generated using the UCSC genome tool phlyoGif [45,46]. The black dot indicates a burst of MER48 insertion as determined by the GEnome-wide Browser for RETroelement (GEBRET) webtool [56]. For GEBRET output and complete sequence alignments see Figure S9 in Additional file 1 and ClustalW alignments in Additional file 3, respectively.
Figure 8
Figure 8
Human EVADR secondary structure. RNAalifold was used to predict a secondary structure based on a consensus fold for apes and OWMs [57]. Shading indicates the 27 base pair positions with nucleotide substitutions. The EVADR alignments showing all nucleotide substitutions and a chart showing only the base pair substitutions are shown in Figures S7 and S8 in Additional file 1, respectively.

Similar articles

Cited by

References

    1. Djebali S, Davis CA, Merkel A, Dobin A, Lassmann T, Mortazavi A, et al. Landscape of transcription in human cells. Nature. 2012;489:101–108. doi: 10.1038/nature11233. - DOI - PMC - PubMed
    1. Carninci P, Kasukawa T, Katayama S, Gough J, Frith MC, Maeda N, et al. The transcriptional landscape of the mammalian genome. Science. 2005;309:1559–1563. doi: 10.1126/science.1112014. - DOI - PubMed
    1. Kapranov P, St Laurent G, Raz T, Ozsolak F, Reynolds CP, Sorensen PH, et al. The majority of total nuclear-encoded non-ribosomal RNA in a human cell is ‘dark matter’ un-annotated RNA. BMC Biol. 2010;8:149. doi: 10.1186/1741-7007-8-149. - DOI - PMC - PubMed
    1. Kapranov P, Cheng J, Dike S, Nix DA, Duttagupta R, Willingham AT, et al. RNA maps reveal new RNA classes and a possible function for pervasive transcription. Science. 2007;316:1484–1488. doi: 10.1126/science.1138341. - DOI - PubMed
    1. Derrien T, Johnson R, Bussotti G, Tanzer A, Djebali S, Tilgner H, et al. The GENCODE v7 catalog of human long noncoding RNAs: analysis of their gene structure, evolution, and expression. Genome Res. 2012;22:1775–1789. doi: 10.1101/gr.132159.111. - DOI - PMC - PubMed

LinkOut - more resources