. 2015 Feb 5:6:383-95.
doi: 10.3762/bjnano.6.38. eCollection 2015.

Hematopoietic and mesenchymal stem cells: polymeric nanoparticle uptake and lineage differentiation

Affiliations

Hematopoietic and mesenchymal stem cells: polymeric nanoparticle uptake and lineage differentiation

Ivonne Brüstle et al. Beilstein J Nanotechnol. .

Abstract

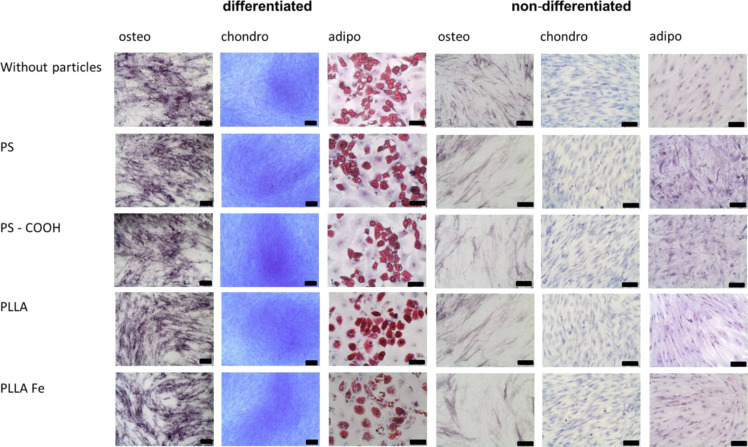
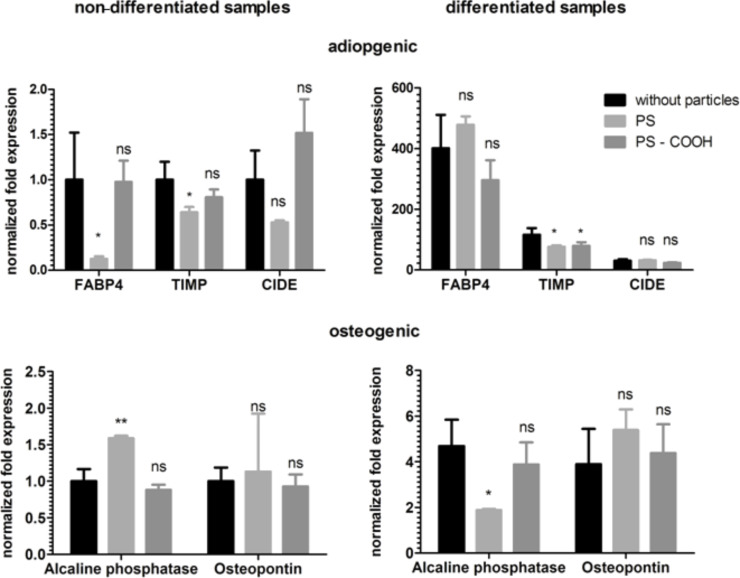
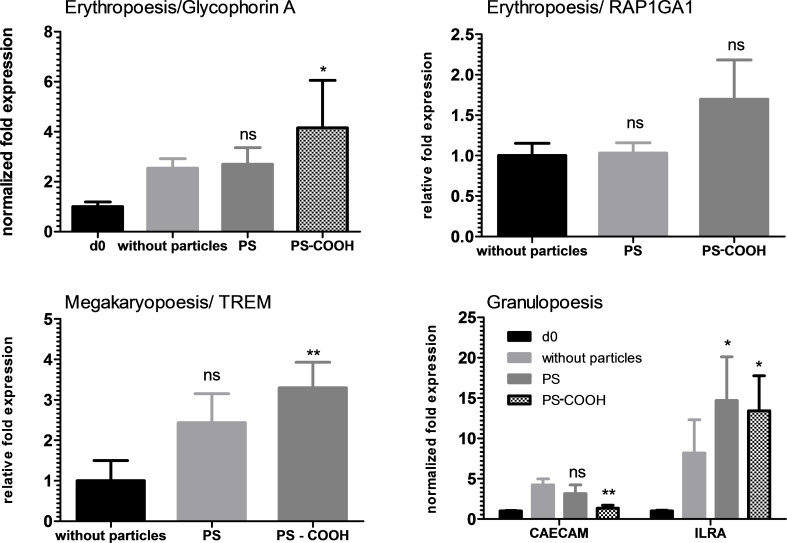
The combination of stem cell therapy and nanoparticles promises to enhance the effect of cellular therapies by using nanocarriers as drug delivery devices to guide the further differentiation or homing of stem cells. The impact of nanoparticles on primary cell types remains much more elusive as most groups study the nanoparticle-cell interaction in malignant cell lines. Here, we report on the influence of polymeric nanoparticles on human hematopoietic stem cells (hHSCs) and mesenchymal stem cells (hMSCs). In this study we systematically investigated the influence of polymeric nanoparticles on the cell functionality and differentiation capacity of hHSCs and hMSCs to obtain a deeper knowledge of the interaction of stem cells and nanoparticles. As model systems of nanoparticles, two sets of either bioinert (polystyrene without carboxylic groups on the surface) or biodegradable (PLLA without magnetite) particles were analyzed. Flow cytometry and microscopy analysis showed high uptake rates and no toxicity for all four tested particles in hMSCs and hHSCs. During the differentiation process, the payload of particles per cell decreased. The PLLA-Fe particle showed a significant increase in the IL-8 release in hMSCs but not in hHSCs. We assume that this is due to an increase of free intracellular iron ions but obviously also depends on the cell type. For hHSCs and hMSCs, lineage differentiation into erythrocytes, granulocytes, and megakaryocytes or adipocytes, osteocytes and chondrocytes, was not influenced by the particles when analyzed with lineage specific cluster of differentiation markers. On the other hand qPCR analysis showed significant changes in the expression of some (but not all) investigated lineage markers for both primary cell types.

Keywords: cytokine secretion; differentiation; hematopoietic stem cells; mesenchymal stem cells; nanoparticles.


Figures

Figure 1
Figure 1
(A) Nanoparticle uptake after 24 h incubation of hMSCs with 300 µg/mL nanoparticles analyzed by flow cytometry. Fluorescence [a.u.] = median fluorescence intensity, arbitrary units. All cells with nanoparticles show a significantly higher fluorescence intensity compared to the negative control (three independent experiments, p < 0.05). (B) Cytotoxicity study of the nanoparticles after 24 h incubation with 300 µg/mL particles analyzed by 7-AAD staining and flow cytometry. Dead cells were not included in the analysis because they constituted less than 1%. The amount of apoptotic cells is given in Supporting Information File 1, Figure S1.
Figure 2
Figure 2
Particle uptake into hMSCs detected by cLSM after 24 h incubation with 300 µg/mL nanoparticles. (A) PS, (B) PS–COOH, (C) PLLA, (D) PLLA–Fe. The cell membrane is stained with CellMask Orange (red), nanoparticles are depicted in green, the cell nucleus is stained with DraQ5 and is pseudo-colored in blue. The white scale bar represents 25 µm.
Figure 3
Figure 3
Particle uptake of hHSCs after 24 h incubation with 300 µg/mL nanoparticles. The nanoparticle content was measured every 2 days during differentiation time. Gating was based on FSC/SSC in order to exclude debris. Further gating was based on the differentiation markers for the erythrocyte lineage (CD71, CD235a), granulocytic lineage (CD11b, CD15) and megakaryocytic lineage (CD41a, CD42b).
Figure 4
Figure 4
Cytokine secretion of hMSCs treated with different nanoparticles: (A) IL-6, (B) IL-8. hMSCs were incubated with 300 µg/mL particles for 24 h, cytokine detection was performed after 5 days of cultivation with a HTRF assay by analyzing the cell culture supernatant. p > 0.05 ns, p < 0.001 ***.
Figure 5
Figure 5
Cytochemical staining to determine the differentiation of hMSCs incubated with different nanoparticles (300 µg/mL nanoparticles, incubation time 24 h, before inducing differentiation). Osteogenic differentiation was demonstrated by alkaline phosphatase activity, chondrogenic differentiation by methylene blue staining of the extracellular matrix, and adipogenic differentiation by Oil-Red O staining of the lipid droplets. Samples without particle incubation (without particles) served as controls. The black scale bar represents 200 µm (except for adipo and non-differentiated samples, 100 µm).
Figure 6
Figure 6
Influence of polystyrene nanoparticles (PS and PS–COOH) on the expression of adipogenic and osteogenic marker genes in hMSCs. Expression was analyzed with qPCR, using GAPDH and B2M as an internal control. The normalized fold expression was calculated with the ΔΔCT method, assigning the non-differentiated sample without particle as a control. p > 0.05 ns, p < 0.05 *, p > 0.01 **; FABP4: fatty acid binding protein 4; TIMP: tissue inhibitor of metalloproteinase; CIDE: cell death inducing DFFA-like effector.
Figure 7
Figure 7
Influence of polylactide nanoparticles (PLLA and PLLA–Fe) on the expression of adipogenic and osteogenic marker genes in hMSCs. Expression was analyzed with qPCR, using GAPDH and B2M as internal controls. The normalized fold expression was calculated with the ΔΔCT method, assigning the non-differentiated sample without nanoparticles as a control. p > 0.05 ns, p < 0.05 *.
Figure 8
Figure 8
qPCR results of polystyrene particles in hHSCs. Carboxy-functionalized polystyrene particles PS–COOH showed a slight increase in glycophorin A, TREM and ILRA transcription, while a decrease for CAECAM was observed. For pure polystyrene, only ILRA was increased.
Figure 9
Figure 9
qPCR results of the polylactide particles in hHSCs. For glycophorin A, a significant increase could be detected when PLLA–Fe particles were used. On the other hand, the granulocytic markers CAECAM and ILRA were suppressed with PLLA–Fe particles.

References

    1. Daldrup-Link H E, Rudelius M, Oostendorp R A J, Settles M, Piontek G, Metz S, Rosenbrock H, Keller U, Heinzmann U, Rummeny E J, et al. Radiology (Oak Brook, IL, U S) 2003;228:760–767. doi: 10.1148/radiol.2283020322. - DOI - PubMed
    1. Ahrens E T, Flores R, Xu H, Morel P A. Nat Biotechnol. 2005;23:983–987. doi: 10.1038/nbt1121. - DOI - PubMed
    1. Tran L A, Hernández-Rivera M, Berlin A N, Zheng Y, Sampaio L, Bove C, da Graça Cabreira-Hansen M, Willerson J T, Perin E C, Wilson L J. Biomaterials. 2014;35:720–726. doi: 10.1016/j.biomaterials.2013.10.013. - DOI - PMC - PubMed
    1. Tseng T C, Hsu S H. Biomaterials. 2014;35:2630–2641. doi: 10.1016/j.biomaterials.2013.12.021. - DOI - PubMed
    1. Chen W, Tsai P-H, Hung Y, Chiou S-H, Mou C-Y. ACS Nano. 2013;7:8423–8440. doi: 10.1021/nn401418n. - DOI - PubMed

LinkOut - more resources