. 2014 Jul 1;3(2):88-105.
doi: 10.2174/2211555203666141117233442.

Molecular Imaging in Optical Coherence Tomography

Affiliations

Molecular Imaging in Optical Coherence Tomography

Scott P Mattison et al. Curr Mol Imaging. .

Abstract

Optical coherence tomography (OCT) is a medical imaging technique that provides tomographic images at micron scales in three dimensions and high speeds. The addition of molecular contrast to the available morphological image holds great promise for extending OCT's impact in clinical practice and beyond. Fundamental limitations prevent OCT from directly taking advantage of powerful molecular processes such as fluorescence emission and incoherent Raman scattering. A wide range of approaches is being researched to provide molecular contrast to OCT. Here we review those approaches with particular attention to those that derive their molecular contrast directly from modulation of the OCT signal. We also provide a brief overview of the multimodal approaches to gaining molecular contrast coincident with OCT.


Figures

Figure 1
Figure 1
Schematic diagram of the photothermal phase sensitive spectral domain optical coherence tomography system. Reprinted with permission from (18). Copyright 2011 SPIE.
Figure 2
Figure 2
Images of EGFR expression in three-dimensional cell constructs containing EGFR+ cells (MDA-MB-468) with and without antibody-conjugated nanospheres (a and c, respectively) and EGFR-cells (MDA-MB-435) with antibody-conjugated nanospheres (b). There was a significant increase in the photothermal signal from EGFR overexpressing cell constructs labeled with antibody conjugated nanospheres (d) compared to the two controls (EGFR+/Nanosphere-and EGFR-/Nanosphere+). N = 17 images for each group, (*, p < 0.0001). Pump power 8.5 kW/cm2. Reproduced with permission from (19). Copyright 2008, American Chemical Society.
Figure 3
Figure 3
(a) B-scan PTOCT image of an arterial-venous phantom sample. (B) Blood SO2 level measured by DWP-OCT (vertical) versus oximeter values (horizontal). Blood is stationary for all measurements. Modified from (37). Copyright 2013 SPIE. -
Figure 4
Figure 4
Representative classification of lipid plaque phantom. Two sites within volumetric data set are shown in (a-d) and (e-h). (a,e) Histology taken through two cross sections within phantom plaque, showing void created by injection of fat emulsion. Corresponding H&E and oil-red-o stains respectively showing void created by the injection of a fat emulsion within center of plaque. (b, f) Optical frequency domain imaging (OFDI) image of phantom lipid plaque corresponding to histology shown in panels a and e respectively. OFDI image shown in panel b is taken through the center of the artificial plaque whereas panel f is taken from the edge of the plaque. (c,g) Probability of cholesterol image derived from the output of the classification algorithm. A high probability of cholesterol is measured from the OFDI image taken through the center of the plaque. A low probability of cholesterol is measured through the edge of the plaque. (d, h) Classification and probability image utilizing a Hue-Saturation-Value (HSV) convention where hue encodes class (red-other, yellow- cholesterol) and saturation and value encode probability. (i) Depth resolved integration of cholesterol probability. (j) Depth resolved integration of collagen probability. Within chemograms, lipid plaque can be seen as a circular region with increased cholesterol (i) and decreased collagen probability (j). Low probability of lipid was coded as black and high probability of lipid was coded as bright yellow. Low probability of collagen was coded as black and high probability of collagen was coded as bright red. Scale bar = 1mm. Reproduced from (60). Copyright 2013 Optical Society of America.
Figure 5
Figure 5
(a) En face METRiCS OCT image with arrows indicating points where the spectra are extracted. White x and y scale bars, 100 μm. (b)–(e) Spectral profiles from corresponding points in (a). Measured spectral profiles (black) are superposed with the theoretical oxy- (dashed red) and deoxy- (dashed blue) hemoglobin normalized extinction coefficients, and normalized absorption of NaFS (dashed green). Also shown are the SO2 levels and the relative absorption of sodium Fluorescence (NaFS) with respect to total hemoglobin (Hb) (ε ≡ NaFS/Hb). All spectra were selected from depths immediately below each corresponding vessel. Reprinted with permission from (48). Copyright 2011 Macmillan.
Figure 6
Figure 6
Cartoon schematic of the principle of MMOCT depicting how a magnetic actuation of nanoparticles inside the imaging volume induces a phase shift in the OCT interferogram. Reprinted with permission from (69). Copyright 2011 IEEE.
Figure 7
Figure 7
Representative MMOCT images from the ex vivo aorta specimens. The visual appearance of the luminal walls of the aortas (a–c) and corresponding histological sections (d–f) reveal the development of early-stage fatty streaks and plaques with lipid cores. OCT structural images (g–i) were superimposed (m–o) with magnetomotive images (j–l). The cross-sectional MMOCT images correspond to the yellow scan lines shown in (a–c). The red and green channels represent the structural OCT intensity and MMOCT signal, respectively. Reprinted with permission from (76). Copyright 2014 Springer.
Figure 8
Figure 8
OCT (red) and MMOCT (green) of ex vivo porcine arteries exposed to SPIO loaded rehydrated lyophilized (SPIO-RL)platelets in a flow chamber. MMOCT contrast is specific to the artery that was injured, due to specific adhesion of SPIO-RL platelets. Lower right inset: TEM of an SPIO-RL platelet, 1 μm scalebar. Reprinted with permission from (69). Copyright 2011 IEEE.
Figure 9
Figure 9
Schematic of the SD SH-OCT layout. The solid gray line represents the fundamental beam path, and the dotted black line represents the beam path for the secondharmonic light. Spect , spectrometer designed for the nth harmonic; DG, diffraction grating; Det, detector; OBJ, objective; NA, numerical aperture. Reproduced from (83). Copyright 2007 Optical Society of America.
Figure 10
Figure 10
(a) SH-OCT image showing an area of 100 × 50 μm in the rat-tail tendon, where many cable-like, parallel oriented, and slightly wavy collagen fiber bundles (fascicles) can be visualized; (b) 60X polarization microscope image of the same sample (scale bar: 10 μm). Reproduced with permission from (87). Copyright 2005 AIP Publishing LLC.
Figure 11
Figure 11
SHOCT image of the overlap of three fish scales, recorded with the reference-arm second- harmonic light polarization parallel to the fundamental light polarization. (b) SHOCT image recorded with the reference-arm second-harmonic light polarization perpendicular to the fundamental light polarization. (c) Polarization-independent image derived from (a) and (b). (d) Image of the anisotropy parameter, β. Reprinted from (88). Copyright 2004 Optical Society of America. Currently, SHOCT is somewhat limited by the prevalent forward scattering of SHG light from collagen. The forward scattered light may be backscattered by a deeper reflector in the sample, confounding localization of the collagen which generated the second harmonic signal. To the best of our knowledge, no exogenous SHG agent has been demonstrated in the literature for SHOCT, further limiting its application.
Figure 12
Figure 12
A schematic diagram of PPOCT. Pump light source: Q-switched 532nm laser, Probe light source: SLD or Ti:Sapphire laser at 830nm center wavelength, L: lens, NDF: neutral density filter, DM: dichroic mirror, M: mirror, DG: diffraction grating, LSC: line-scanning camera. Reprinted from (90). Copyright 2013 John Wiley & Sons, Inc.
Figure 13
Figure 13
Flowchart of data collection and processing of PPOCT. An M-scan of OCT is collected and a Fourier transform is taken at every depth. The modulation frequency is extracted at each depth to compile the PPOCT A-line.
Figure 14
Figure 14
Fig. 5. A) Photo of transgenic zebra danio fish expressing dsRed in its skeletal muscle. B) OCT cross-section recorded through the back of the fish, anterior to the dorsal fin as indicated by the top white box in the photo. C) Overlay of the corresponding ground state recovery PPOCT (gsrPPOCT) image onto the OCT image in B. The color bar indicates the SNR of the gsrPPOCT signal (max 47 dB). D) Derivative image derived from panel C. E, F, G) Same as B, C, and D except recorded along a cross-section (bottom white box) bisecting the pectoral fin (PF) and continuing into the lateral line (LL). The maximum recorded SNR gsrPPOCT in panel E was 37 dB. The scale box is 200 μm×200 μm.Reprinted with permission from (89). Copyright 2008 Optical Society of America.
Figure 15
Figure 15
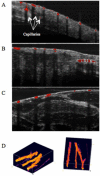
(A), (B), and (C) are PPOCT B-scans overlaid on the corresponding co-registered OCT B-scans. X. laevis vasculature are clearly depicted. Arrows in (A) point to capillaries that were not visible in conventional OCT. Scale bar is 100 μm. (D) Two views of a volumetric reconstruction of the PPOCT data recorded on a euthanized Xenopus tadpole. The volume is 2 mm × 2 mm × 1 mm. The lines in the lower left and right edges of the images are artifacts. Modified from (90). Copyright 2013 John Wiley & Sons, Inc.
Figure 16
Figure 16
Schematic diagram of the multimodality imaging system by combining OCT and FLIM subsystems. L1, L2 and L5: free-space collimation and coupling lenses, L3, L4, L6-L12: fiber-connected collimation and coupling lenses, NDF: neutral density filter, M1-M4: mirrors, DM1-DM4: dichroic mirrors, and F1-F4: filters. Reprinted with permission from (101). Copyright 2010 Optical Society of America.
Figure 17
Figure 17
Solid SCST and Life spectral curves. (a) and (b) OCT image of ovary with solid SCST and corresponding histology. (c) and (d) OCT image of solid SCST within benign and corresponding histology. (e) Solid spectral curves. SCST: sex cord-stromal tumor, arrow: benign cyst lining, asterisk: vascular spaces, C: adjacent benign cyst, Scale bar: 500 μm, Con: Control, VCD: 4-vinylcyclohexene diepoxide, DMBA:7,12-dimethylbenz[a]anthracene, Grouping (IP injection/Ovarian injection). Reprinted with permission from (98). Copyright 2010 Landes Bioscience.
Figure 18
Figure 18
In-vivo co-registered OCT and FLIM images of SCC with hamster check pouch model. (a) OCT 3-D volume shows a thick middle region surrounded by thinner tissue. (b) and (c) sample OCT cross-sectional image and corresponding histology. (d) FLIM images showed two distinct regions: a center area with a fluorescence that is characteristic of nicotinamide adenine dinucleotide (NADH) and flavin adenine dinucleotide (FAD), and a surrounding area with an emission that is characteristic of collagen. Tumor area (tumor (T), scale bar = 300 μm, and field of view: 2 × 2 mm2). Reprinted with permission from (5). Copyright 2010 IEEE.
Figure 19
Figure 19
In-vivo co-registered OCT/FLOT image of subcutaneous human breast tumor xenograft in a mouse model. (a) a cross-sectional OCT image of tumor. The boundary between skin and tumor is clearly visible (arrow) (b) Co-registered FLOT image of tumor (c) Fused OCT/FLOT image and (d) corresponding histology. scalebar = 1mm. Reprinted with permission from (103). Copyright 2010 IEEE.
Figure 20
Figure 20
OCT Image and Raman shift of ex-vivo malignant human breast tissue from OCT/RS system. (a) OCT cross-sectional image, normal region of tissue (solid line), malignant region of tissue (dashed line) (b) Intensity of Raman shift signal from the (a), scalebar = 500 μm. Reprinted with permission from (104). Copyright 2010 Optical Society of America.

Similar articles

Cited by

References

    1. Gora MJ, Sauk JS, Carruth RW, Gallagher KA, Suter MJ, Nishioka NS, et al. Tethered capsule endomicroscopy enables less invasive imaging of gastrointestinal tract microstructure. Nature Medicine. 2013;19(2):238–40. - PMC - PubMed
    1. Chen Y, Aguirre AD, Hsiung PL, Desai S, Herz PR, Pedrosa M, et al. Ultrahigh resolution optical coherence tomography of Barrett's esophagus: preliminary descriptive clinical study correlating images with histology. Endoscopy. 2007;39(7):599–605. - PubMed
    1. Karl A, Stepp H, Willmann E, Buchner A, Hocaoglu Y, Stief C, et al. Optical coherence tomography for bladder cancer -- ready as a surrogate for optical biopsy? Results of a prospective mono-centre study. European journal of medical research. 2010;15(3):131–4. - PMC - PubMed
    1. Kim CS, Wilder-Smith P, Ahn YC, Liaw LHL, Chen ZP, Kwon YJ. Enhanced detection of early-stage oral cancer in vivo by optical coherence tomography using multimodal delivery of gold nanoparticles. Journal of Biomedical Optics. 2009;14(3) - PMC - PubMed
    1. Jo JA, Applegate BE, Park J, Shrestha S, Pande P, Gimenez-Conti IB, et al. In Vivo Simultaneous Morphological and Biochemical Optical Imaging of Oral Epithelial Cancer. Ieee T Bio-Med Eng. 2010;57(10):2596–9. - PMC - PubMed

LinkOut - more resources